Average Volume
Average volume is the typical amount traded over a recent number of candles, used as a baseline to judge whether current volume is high or low.
No term matches that search. Try a shorter word.
Average volume is the typical amount traded over a recent number of candles, used as a baseline to judge whether current volume is high or low.
Backtesting is testing a trading idea on past price data to see how it would have performed.
A bear market is a long period in which prices are generally falling.
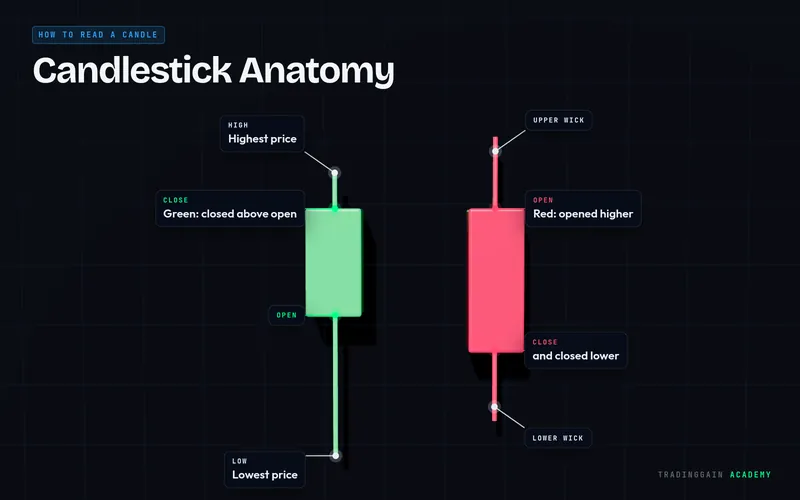
A bearish candle is a candle that closed lower than it opened, usually shown in red.
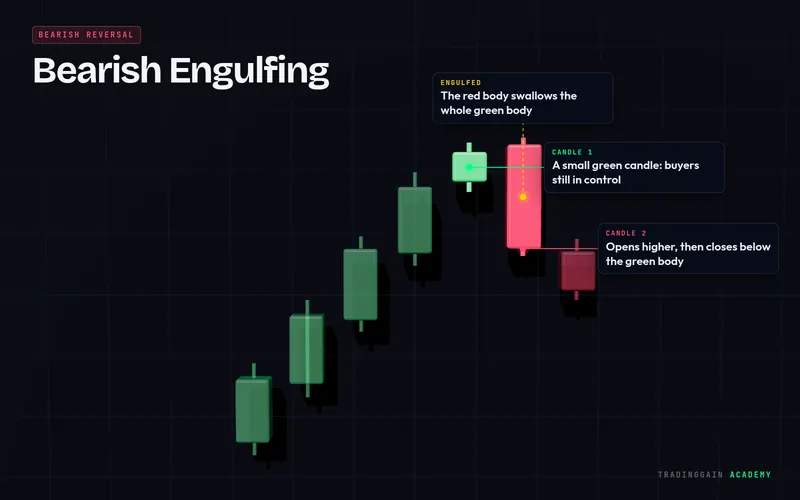
A bearish engulfing is a two-candle pattern where a red candle completely swallows the body of the green candle before it.
Bollinger Bands are three lines drawn around price: a moving average in the middle and two bands above and below that widen and narrow with volatility.
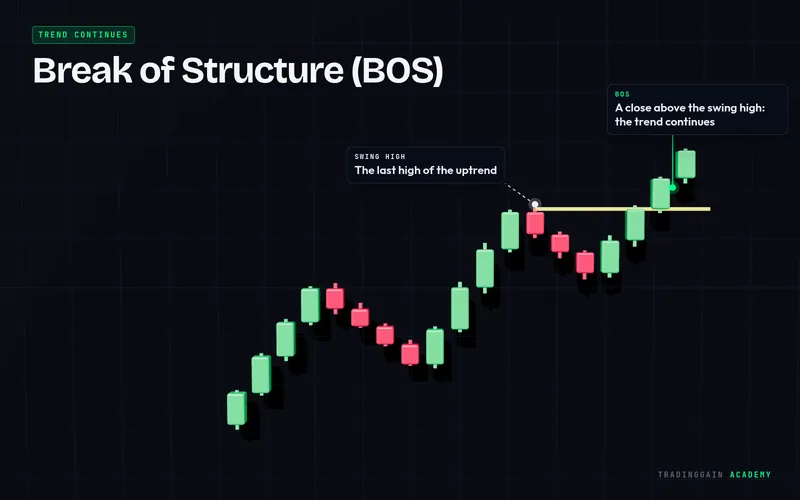
A break of structure is when price closes beyond a recent swing point in the direction of the trend, confirming the trend is continuing.
Breakeven means moving your stop-loss to your entry price, so the trade can no longer lose money.
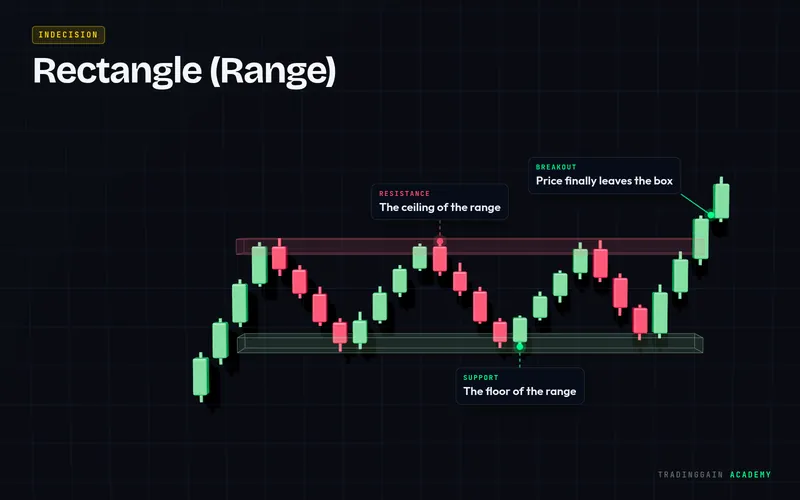
A breakout is when price moves and closes beyond a support, resistance or trendline that had been holding it.
A bull market is a long period in which prices are generally rising.
A bullish candle is a candle that closed higher than it opened, usually shown in green.
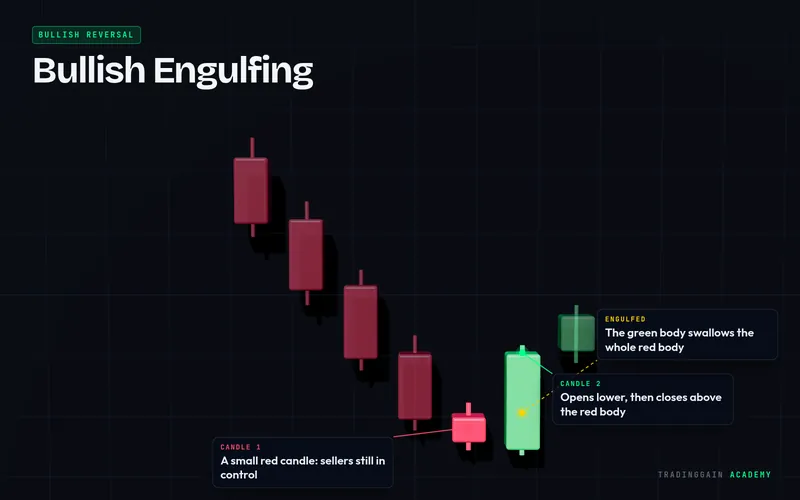
A bullish engulfing is a two-candle pattern where a green candle completely swallows the body of the red candle before it.
The body is the thick part of a candlestick, running from the opening price to the closing price of that period.
A candlestick is a single bar on a price chart that shows where price opened, how high and how low it went, and where it closed during one period of time.
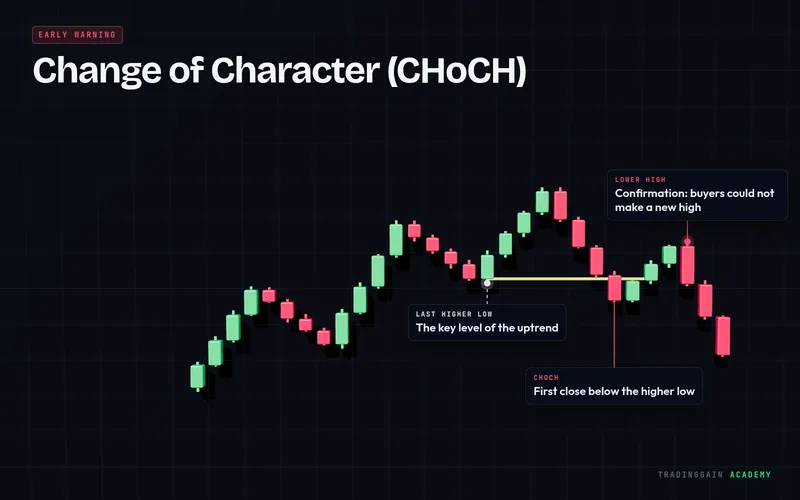
A Change of Character is the first break of structure against the current trend, an early sign that the trend may be reversing.
Divergence is when price and an indicator such as RSI move in different directions, which can be an early sign that a move is losing strength.
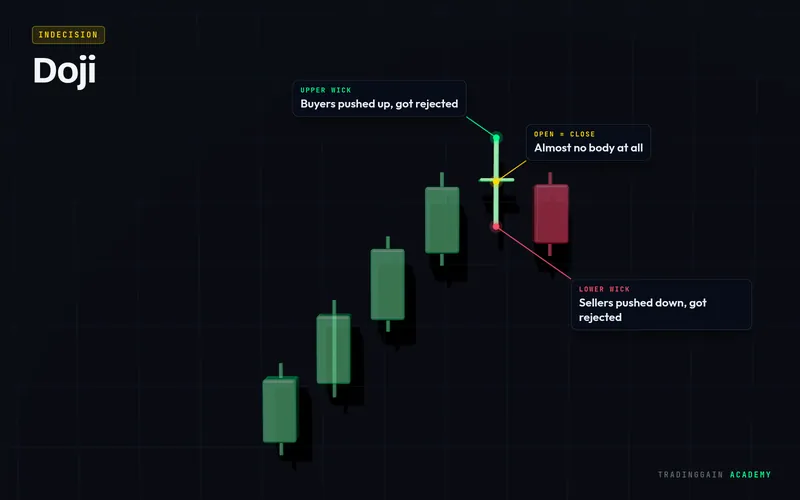
A doji is a candle where the open and close are almost the same price, leaving a very small body. It shows indecision between buyers and sellers.
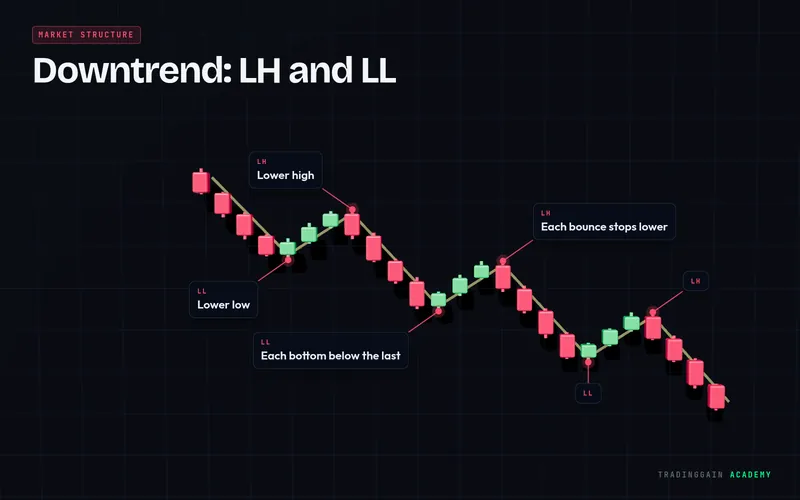
A downtrend is a market that keeps making lower highs and lower lows.
The entry is the price at which you open a trade.
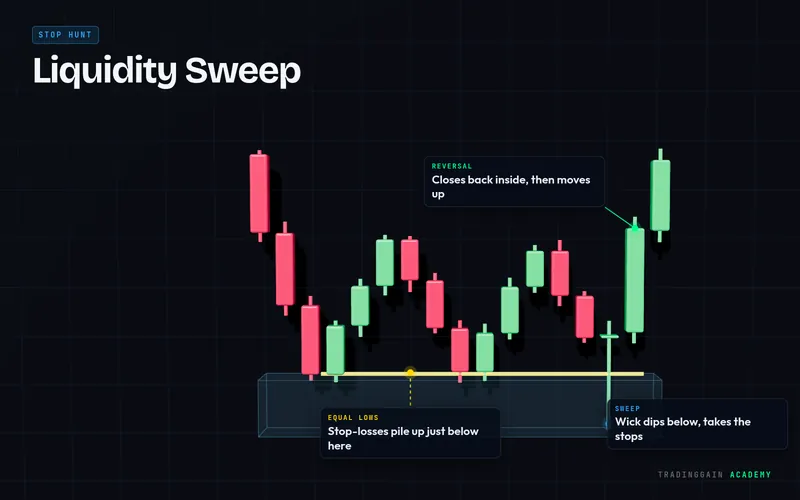
Equal highs or equal lows are two or more swing points at almost the same price, which attract a large cluster of stop-loss orders.
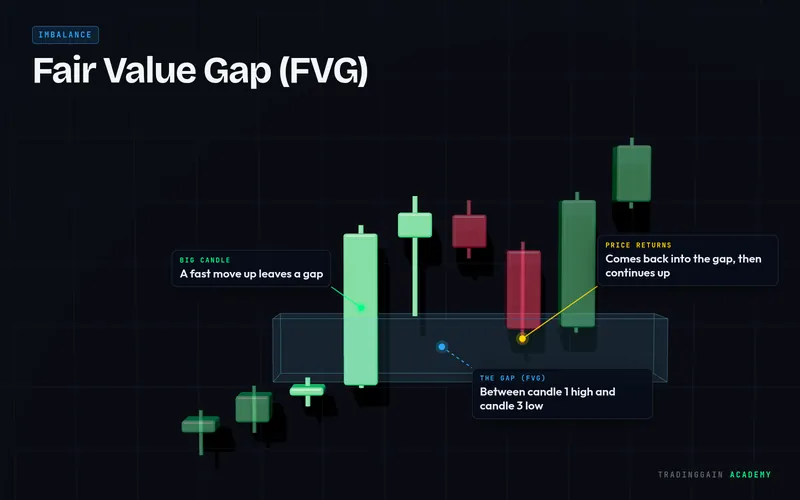
A fair value gap is a three-candle pattern where a strong middle candle leaves a gap between the wick of the first candle and the wick of the third.
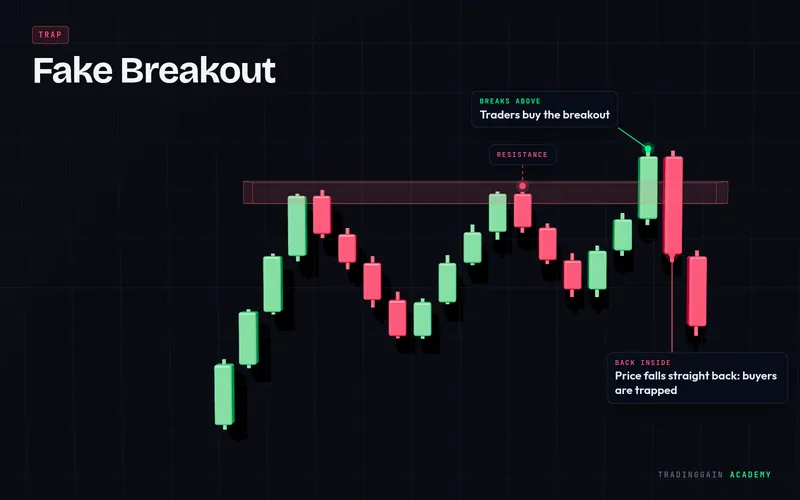
A fake breakout is when price moves beyond a level but quickly returns back inside, trapping traders who entered on the break.
Fibonacci retracement is a tool that draws levels, such as 38.2%, 50% and 61.8%, between a swing high and swing low to estimate where a pullback might stop.
Futures are contracts that let you trade the price of an asset, long or short, usually with leverage, without owning the asset itself.
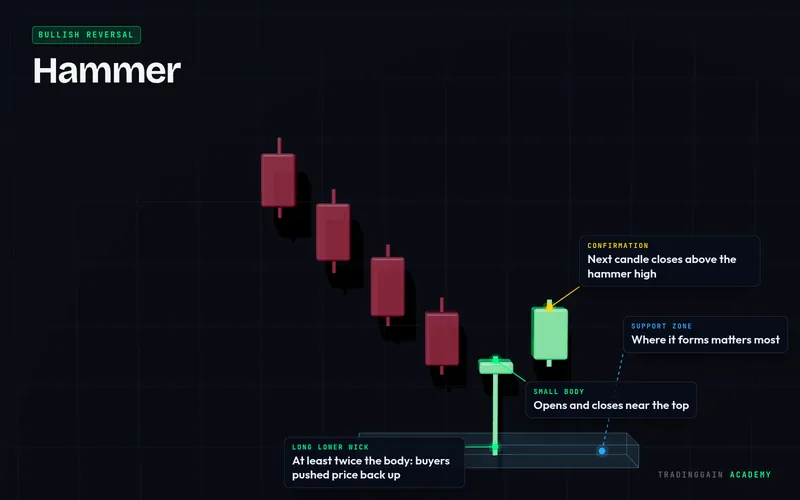
A hammer is a candle with a small body near the top and a long lower wick, showing that sellers pushed price down but buyers pushed it back up.
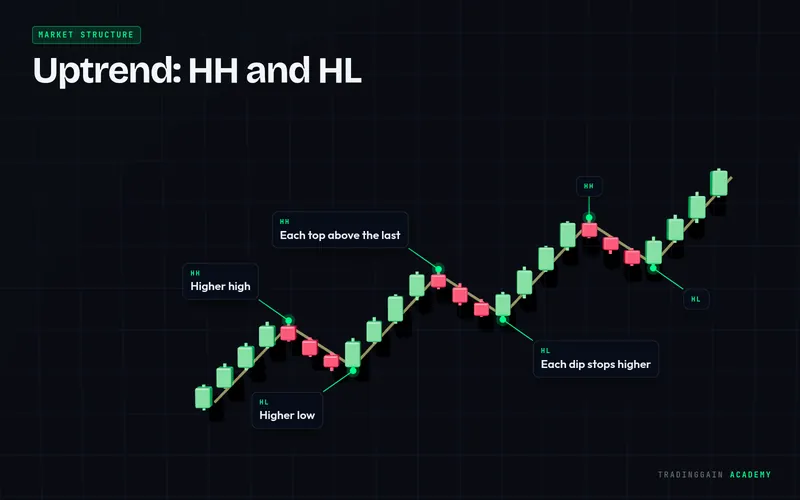
A higher high is a new peak that is above the previous peak. A series of higher highs is a sign of an uptrend.
A higher low is a pullback that stops above the previous low. A series of higher lows is a sign of an uptrend.
An indicator is a calculation based on price or volume, drawn on the chart to help read momentum, trend or volatility.
Leverage lets you open a position larger than your own money by borrowing from the exchange, which multiplies both profits and losses.
Liquidation is when an exchange forcibly closes a leveraged position because the losses have used up the margin backing it.
In trading, liquidity is the pool of pending orders, especially stop-losses, that sits around obvious highs and lows on a chart.
A liquidity sweep is when price briefly pushes beyond an obvious high or low to trigger the stop-losses there, then quickly reverses.
A long position is a trade that profits when price goes up.
A lower high is a rally that stops below the previous peak. A series of lower highs is a sign of a downtrend.
A lower low is a drop that goes below the previous low. A series of lower lows is a sign of a downtrend.
MACD is a momentum indicator built from the difference between two exponential moving averages, plotted with a signal line and a histogram.
Market structure is the pattern of highs and lows on a chart that shows whether the market is trending up, trending down or ranging.
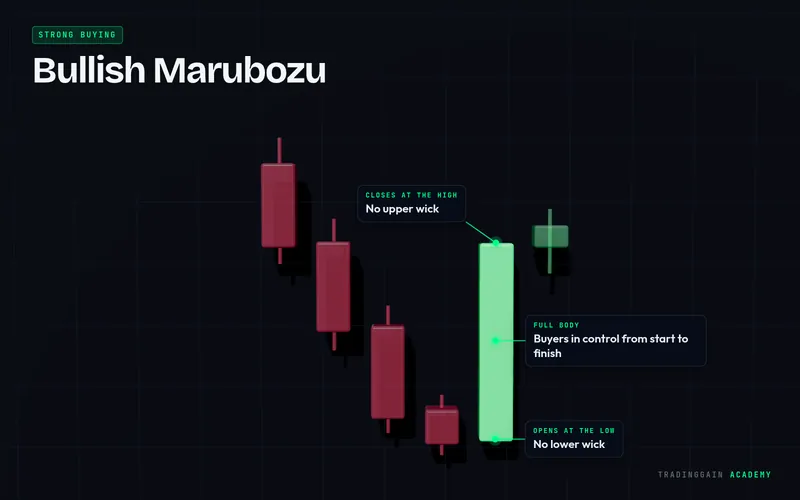
A marubozu is a candle with a long body and little or no wick, showing that one side controlled price for the whole period.
A moving average is a line showing the average price over a set number of recent candles, used to smooth out noise and show the trend.
OHLC stands for Open, High, Low and Close, the four prices that every candlestick is built from.
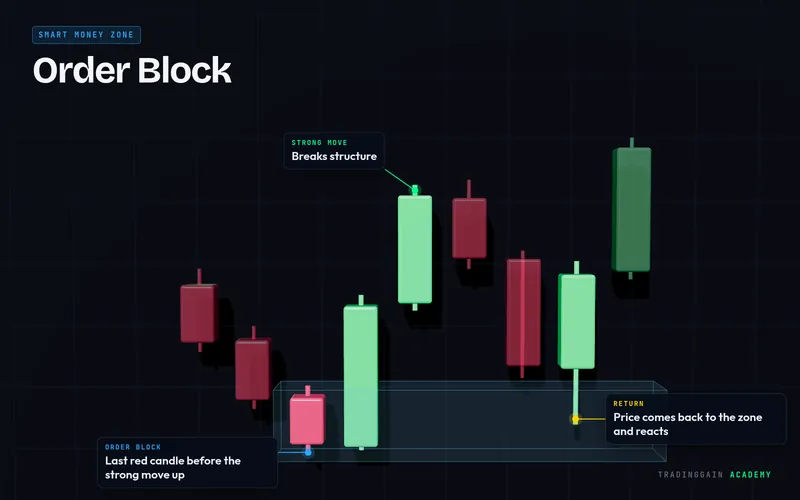
An order block is the last opposite-coloured candle before a strong move, marking a zone where large players are thought to have placed their orders.
Overbought and oversold describe a market that has risen or fallen a lot in a short time, usually measured with an indicator such as RSI.
Position sizing is deciding how big a trade to take, so that if the stop-loss is hit you lose only a fixed, small part of your account.
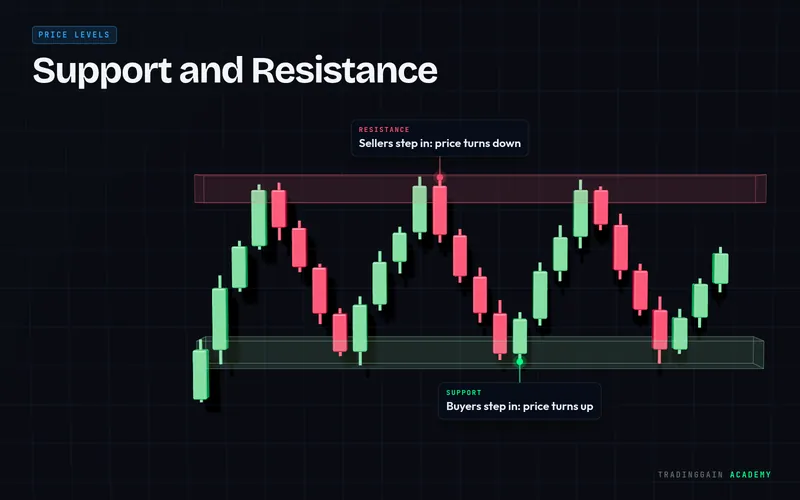
Resistance is a price area where a rising market tends to stop and turn back down, because sellers step in there.
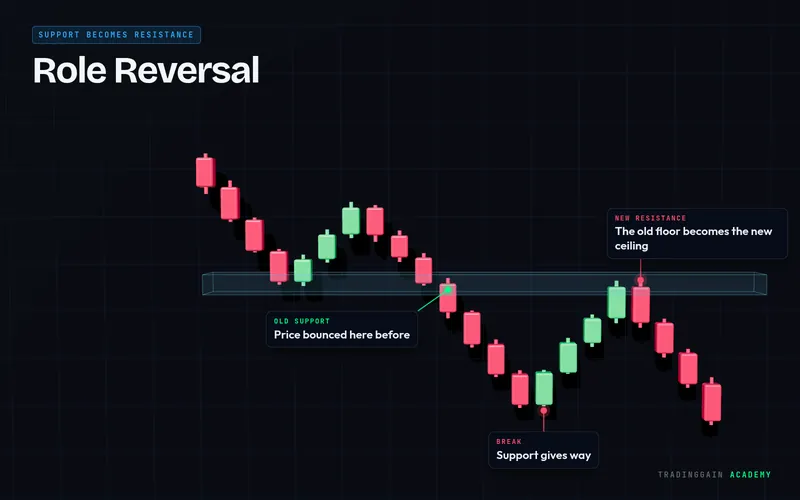
A retest is when price comes back to a level it has just broken, to test whether that level now holds from the other side.
The risk-reward ratio compares how much you could lose on a trade with how much you could gain.
Role reversal is when a broken support level becomes new resistance, or a broken resistance level becomes new support.
The RSI is a momentum indicator that measures the speed of recent price moves on a scale from 0 to 100.
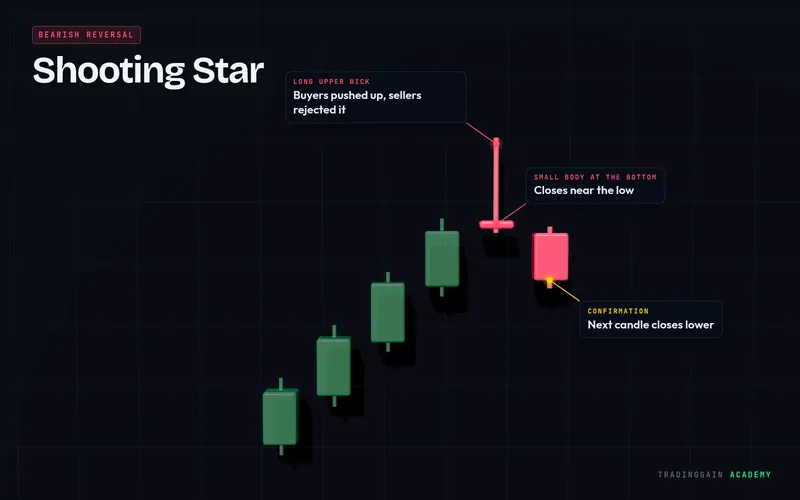
A shooting star is a candle with a small body near the bottom and a long upper wick, showing that buyers pushed price up but sellers rejected it.
A short position is a trade that profits when price goes down.
A sideways market is when price moves up and down between a support and a resistance without a clear trend.
Smart Money Concepts is a trading approach that studies how large players move price, using ideas such as liquidity, order blocks, fair value gaps and market structure.
Spot trading is buying and selling the actual asset for immediate delivery, without leverage.
A stop-loss is an order that closes your trade automatically at a set price, limiting how much you can lose if the market moves against you.
Support is a price area where a falling market tends to stop and bounce, because buyers step in there.
A support or resistance zone is a band of prices, rather than one exact number, where price has repeatedly reacted.
A swing high is a peak on the chart where price turned down, with lower highs on both sides of it.
A swing low is a dip on the chart where price turned up, with higher lows on both sides of it.
Take profit is a price at which you close a trade, or part of it, to lock in profit.
A timeframe is how much time each candle on a chart represents, such as 15 minutes, 1 hour, 4 hours or 1 day.
Top-down analysis means reading the market from a higher timeframe down to a lower one: the big chart for direction, a middle chart for structure and a small chart for entry.
A trailing stop is a stop-loss that you move in the direction of your trade as price moves in your favour, locking in more profit over time.
A trend is the overall direction in which price is moving: up, down or sideways.
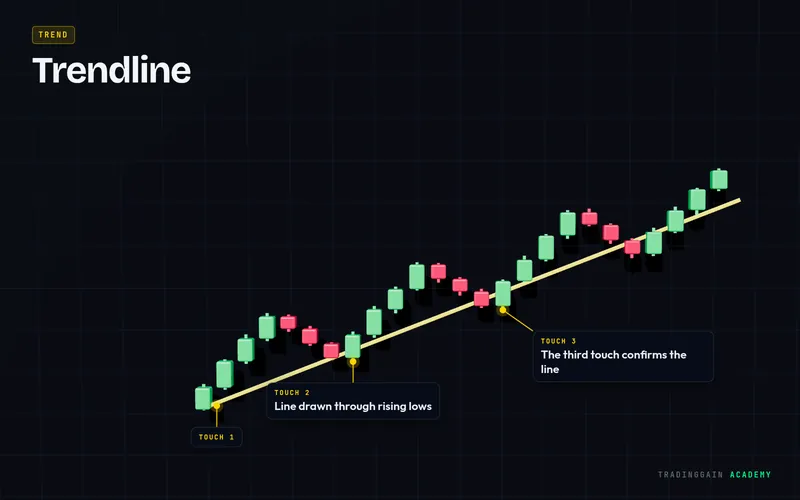
A trendline is a straight line drawn through the lows of an uptrend or the highs of a downtrend, showing the path price has been respecting.
An uptrend is a market that keeps making higher highs and higher lows.
Volatility is how much and how quickly price moves up and down.
Volume is the amount of an asset traded during one candle. It shows how much participation, and therefore how much strength, is behind a price move.
A volume spike is a candle with volume far above the recent average, showing a sudden burst of activity.
VWAP, the Volume Weighted Average Price, is the average price traded during a session, weighted by how much volume traded at each price.
Put each concept to work inside the TradingGain app, without risking real money.