// Definition
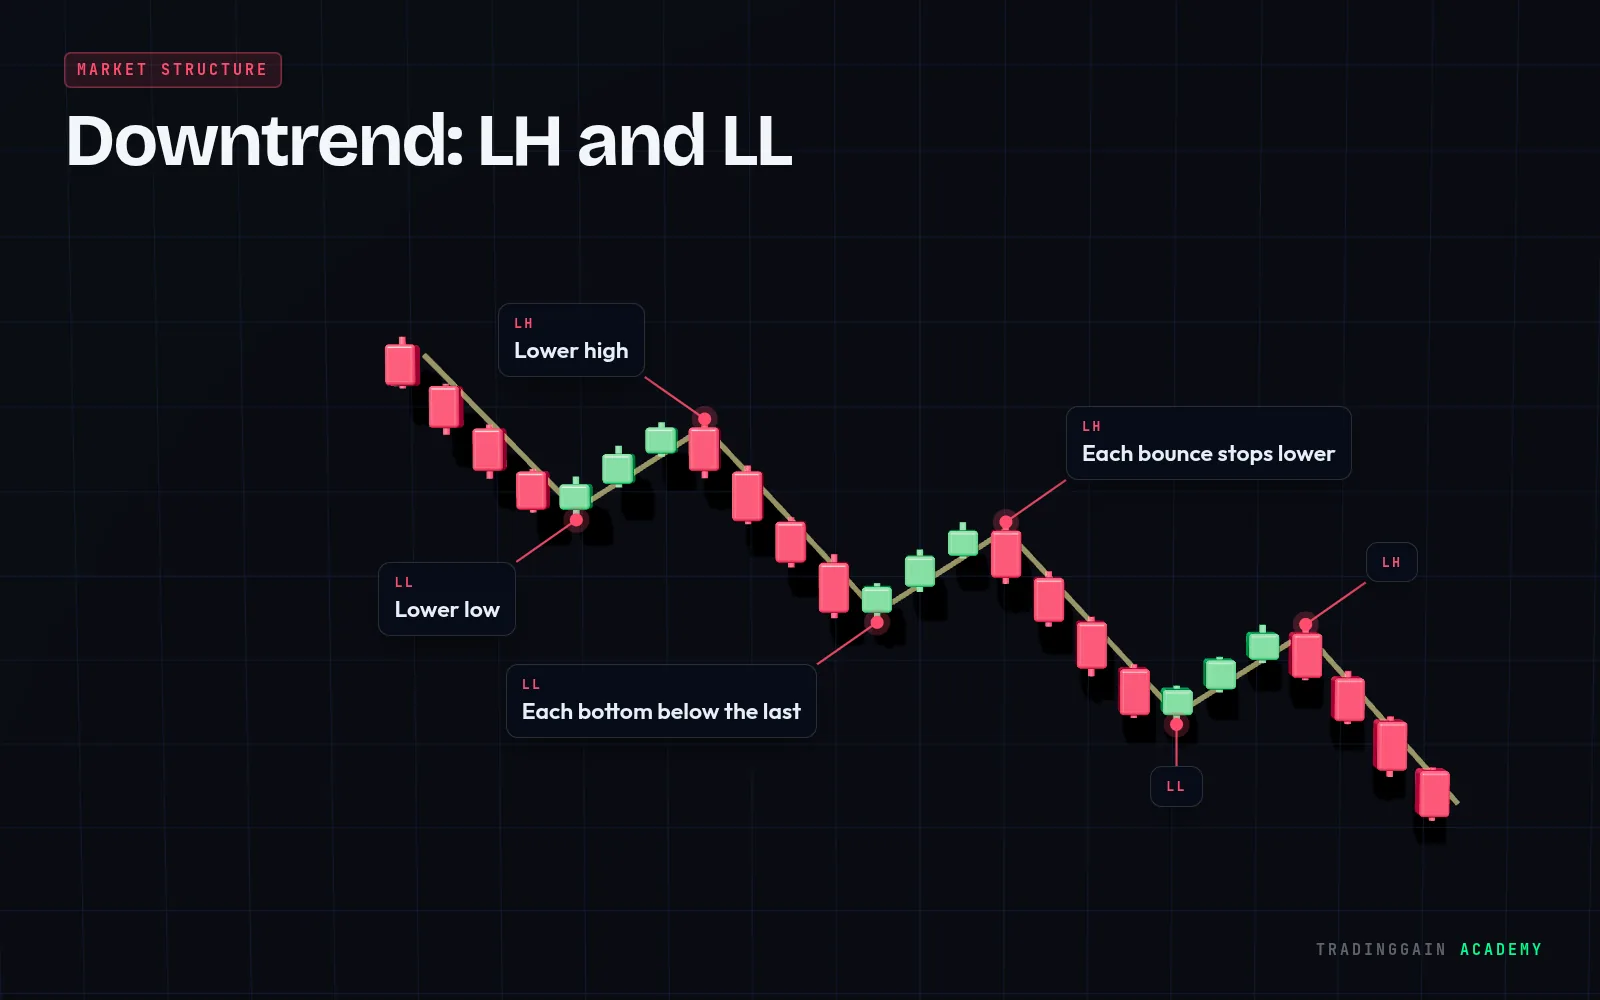
A lower low is a drop that goes below the previous low. A series of lower lows is a sign of a downtrend.
Explained simply
When sellers are strong, each drop pushes past the bottom of the last one. That new bottom is a lower low.
Together with lower highs, lower lows define a downtrend. If price stops making new lower lows and starts holding higher, the downtrend may be ending.
Tip
A lower low that is quickly reclaimed can be a liquidity sweep rather than a real continuation, so watch the close.
 Learn it on a real chart · EP 04Market Structure: HH, HL, LH and LLWatch the free lesson →
For education only, not financial advice. Trading is risky and you can lose money.