Doji
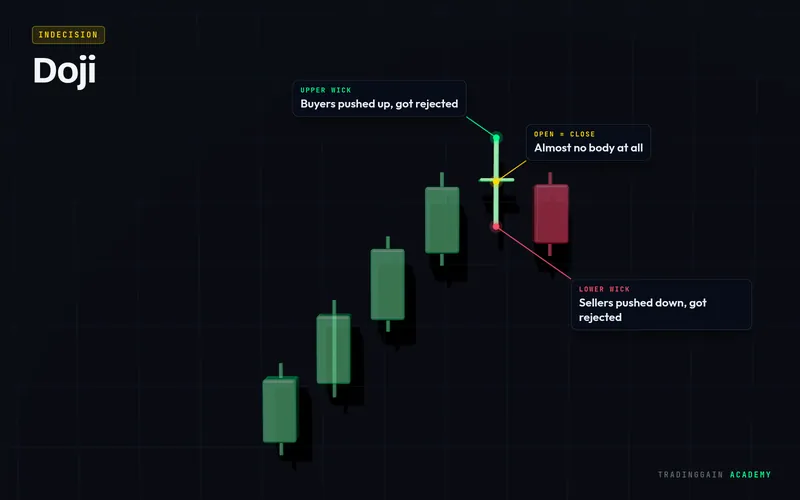
A doji is a candle whose open and close are at almost the same price, so it has little or no body. It shows that buyers and sellers ended the period in a draw.
No pattern matches that search.
A doji is a candle whose open and close are at almost the same price, so it has little or no body. It shows that buyers and sellers ended the period in a draw.
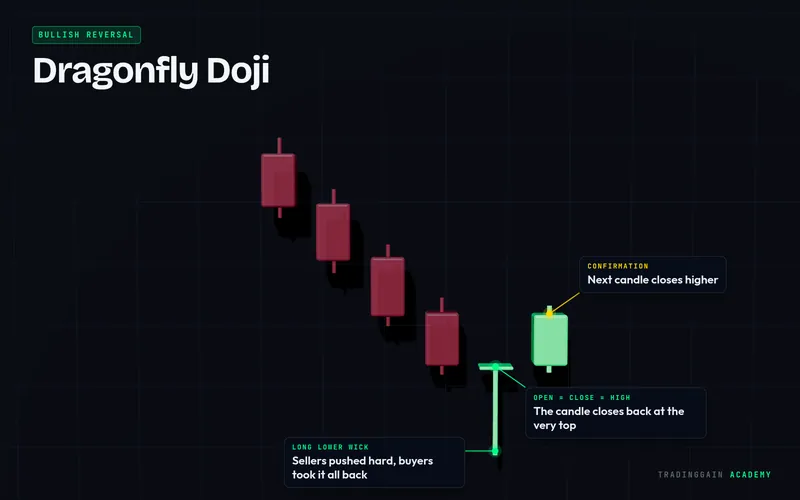
A dragonfly doji is a doji whose open, close and high are all at about the same price, with a long lower wick. It looks like a T.
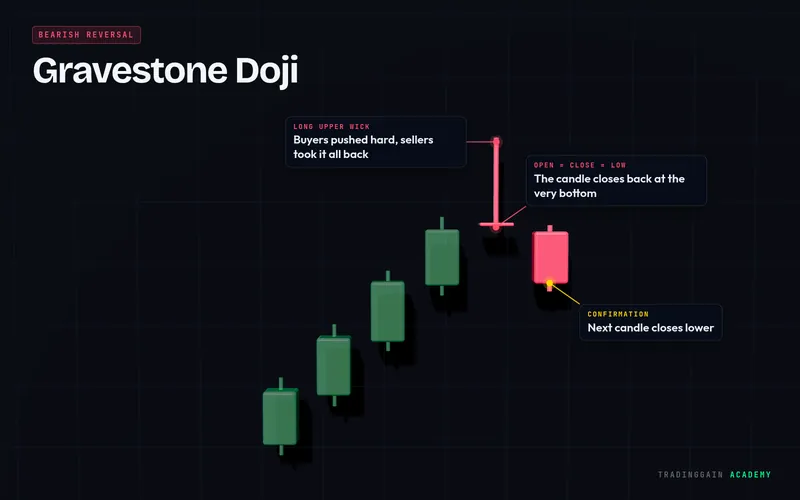
A gravestone doji is a doji whose open, close and low are all at about the same price, with a long upper wick. It looks like an upside-down T.
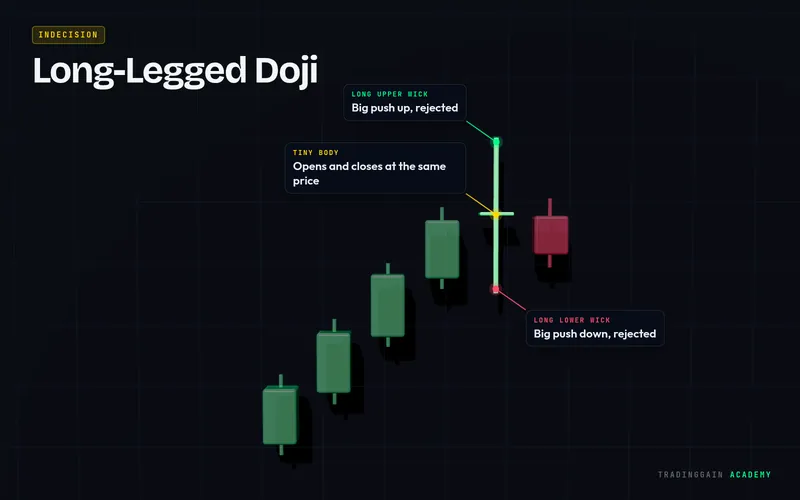
A long-legged doji is a doji with long wicks both above and below a tiny body. Price swung far in both directions and ended where it started.
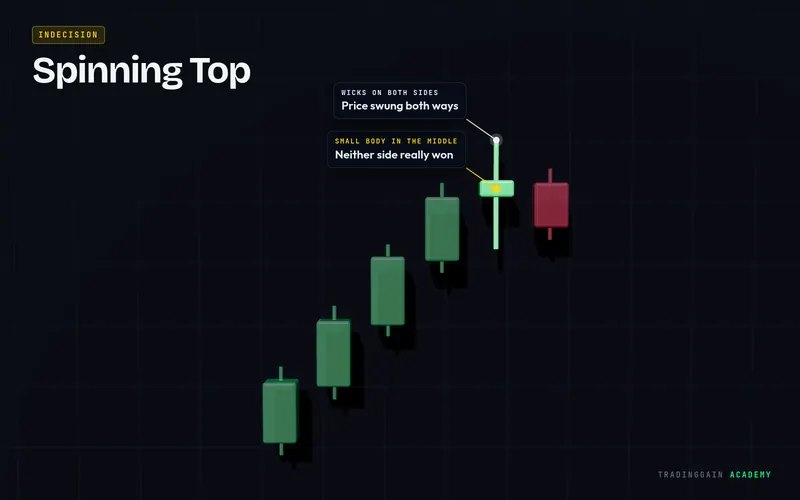
A spinning top is a candle with a small body in the middle and wicks of similar length above and below. It shows a pause where neither side took control.
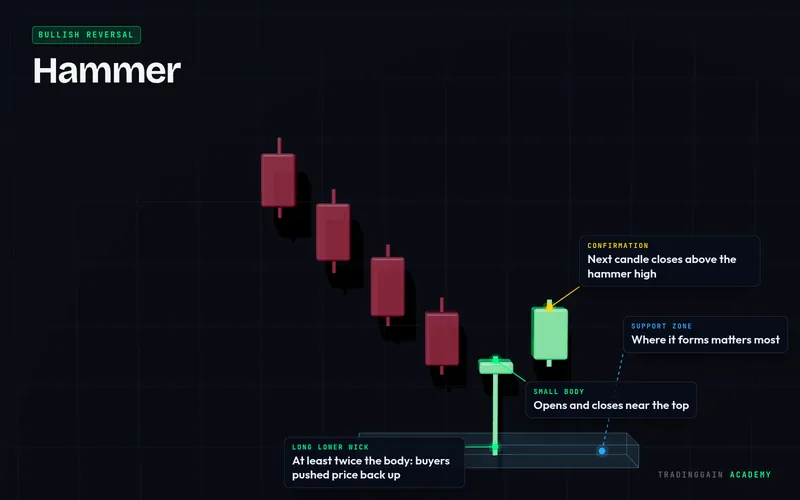
A hammer is a candle with a small body near the top and a long lower wick, at least about twice the size of the body. It appears after a decline and shows buyers pushing price back up.
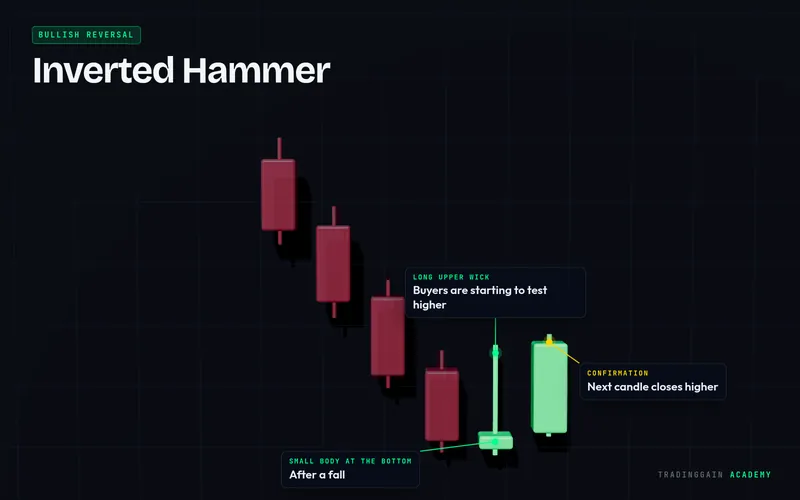
An inverted hammer is a candle with a small body near the bottom and a long upper wick, appearing after a decline. It looks like an upside-down hammer.

A hanging man is a candle with a small body near the top and a long lower wick that appears after a rally. It looks exactly like a hammer, but its location makes it a warning.
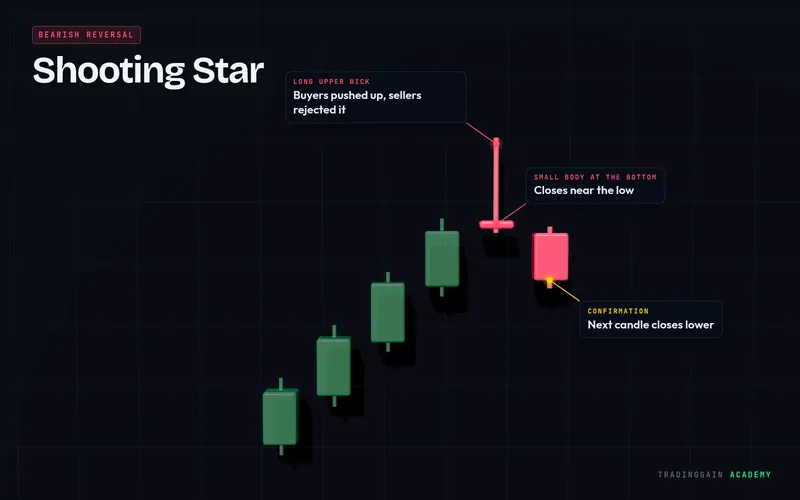
A shooting star is a candle with a small body near the bottom and a long upper wick, appearing after a rally. It shows buyers pushing up and sellers rejecting the move.
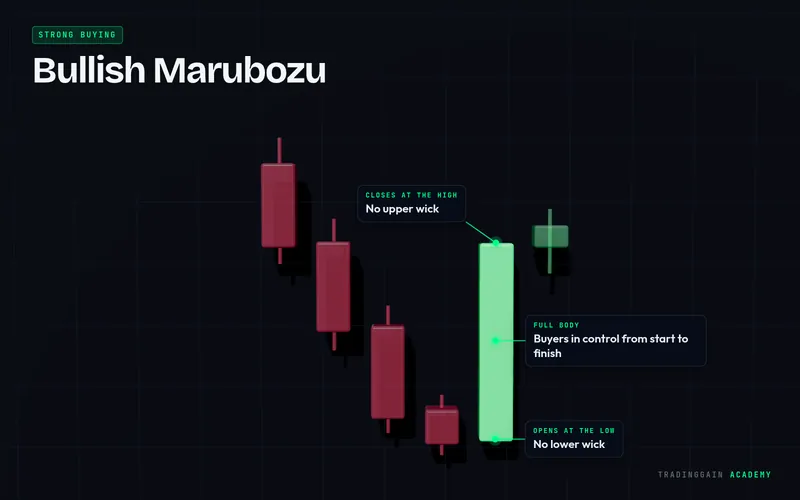
A bullish marubozu is a long green candle with no wicks, or almost none. It opened at its low and closed at its high.
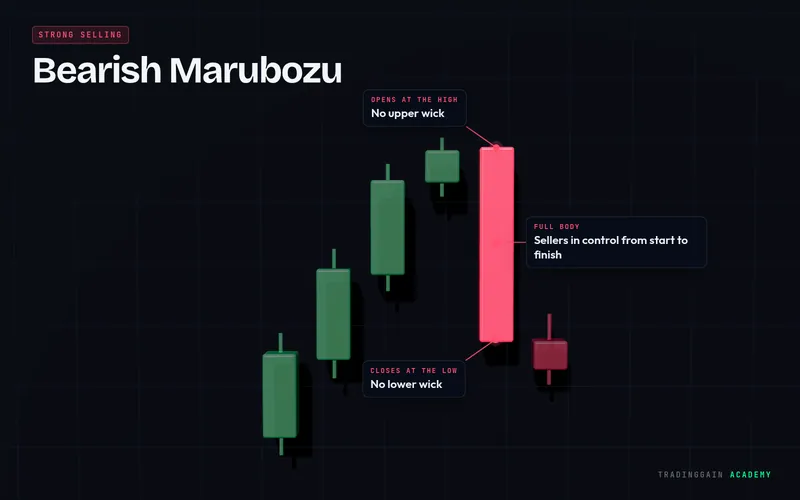
A bearish marubozu is a long red candle with no wicks, or almost none. It opened at its high and closed at its low.
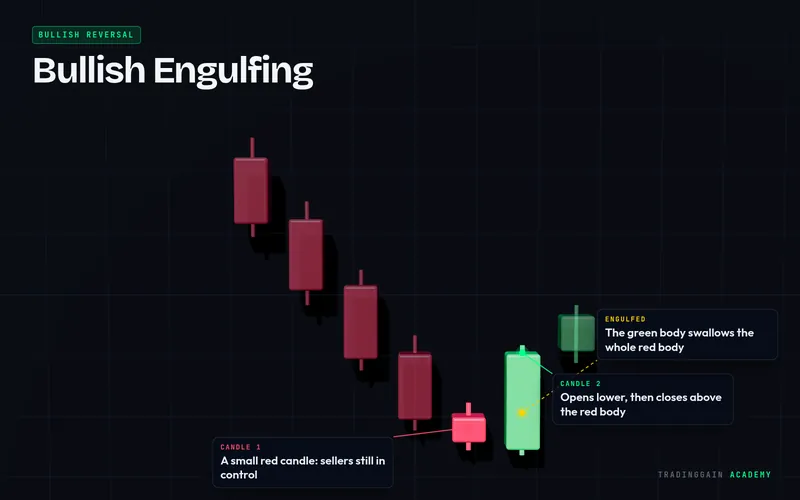
A bullish engulfing pattern is two candles: a red candle followed by a green candle whose body completely covers the red body. It shows buyers suddenly taking over.
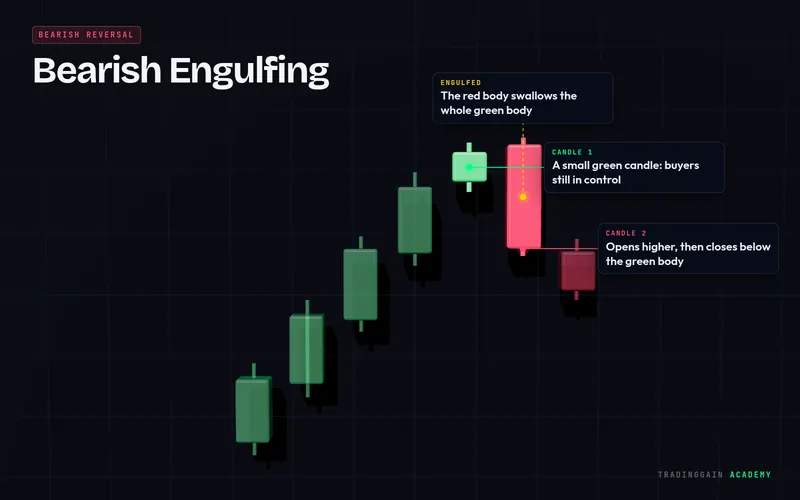
A bearish engulfing pattern is two candles: a green candle followed by a red candle whose body completely covers the green body. It shows sellers suddenly taking over.
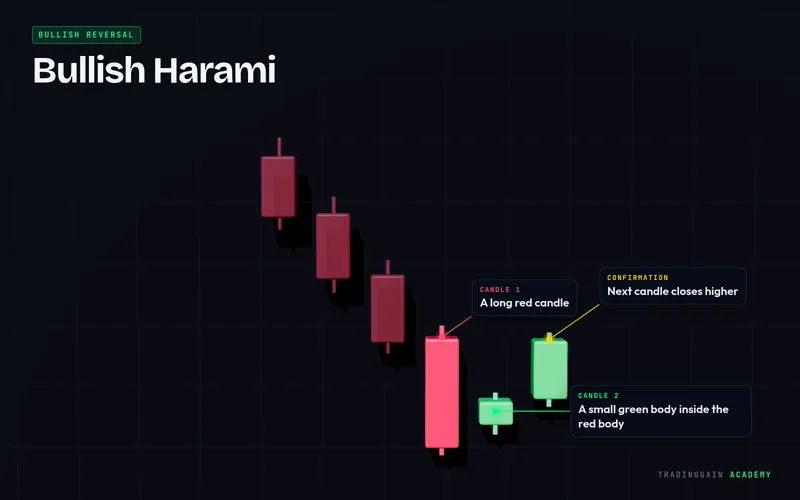
A bullish harami is a long red candle followed by a small green candle whose body sits completely inside the red body. Harami means pregnant in Japanese, which describes the shape.
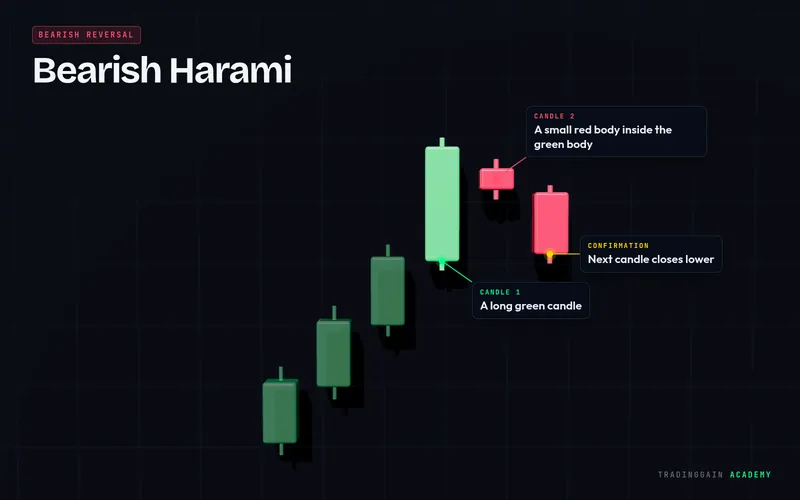
A bearish harami is a long green candle followed by a small red candle whose body sits completely inside the green body.
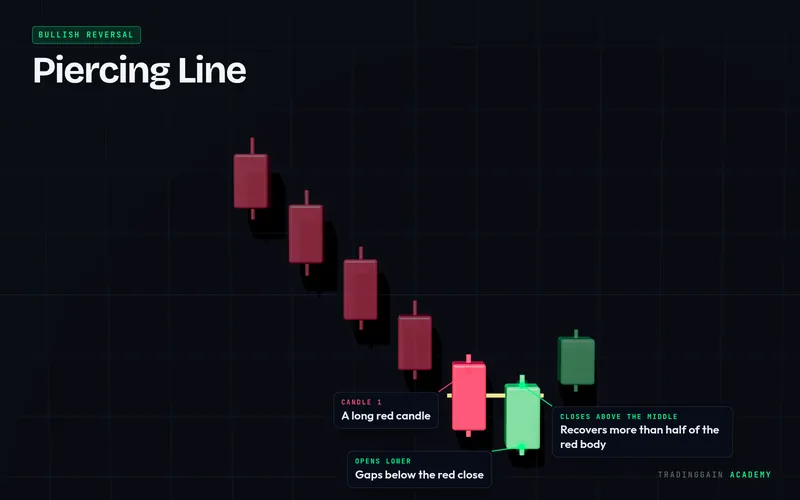
A piercing line is a long red candle followed by a green candle that opens below the red close and then closes above the midpoint of the red body.
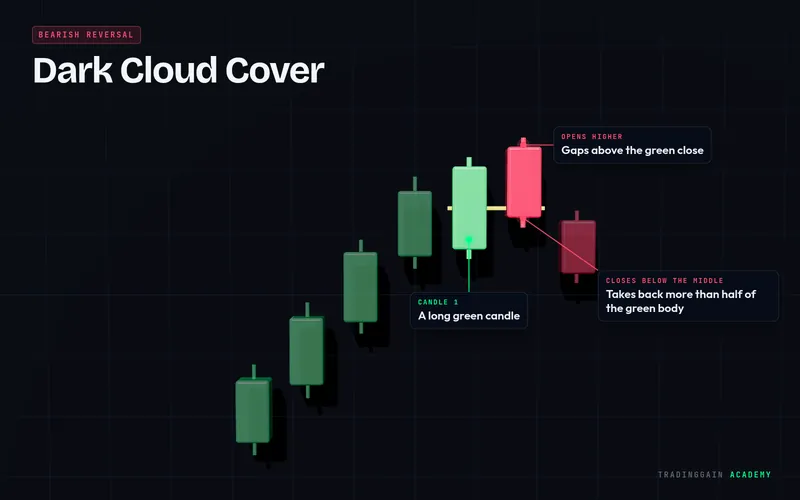
Dark cloud cover is a long green candle followed by a red candle that opens above the green close and then closes below the midpoint of the green body.
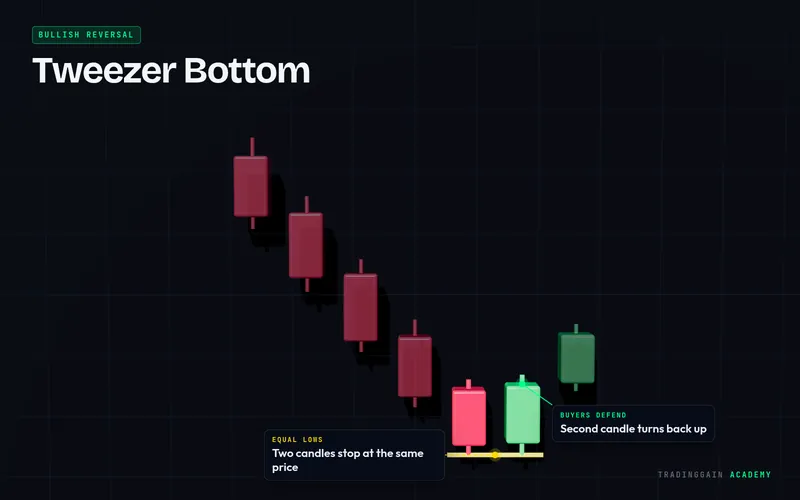
A tweezer bottom is two candles in a row that make almost the same low after a decline. Usually the first is red and the second is green.
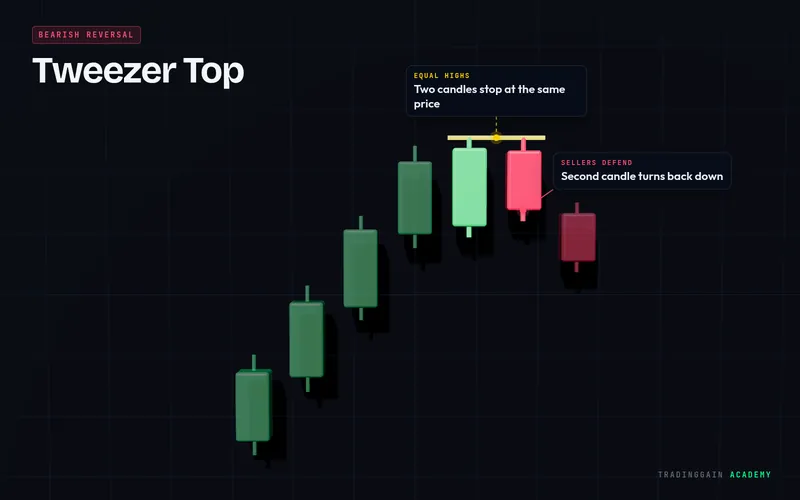
A tweezer top is two candles in a row that make almost the same high after a rally. Usually the first is green and the second is red.
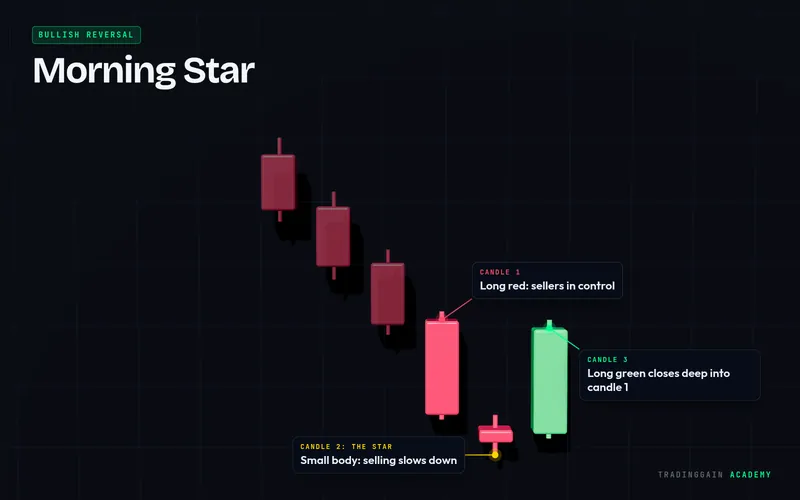
A morning star is a three-candle bullish reversal: a long red candle, a small candle (the star) and then a long green candle that closes well into the first candle.
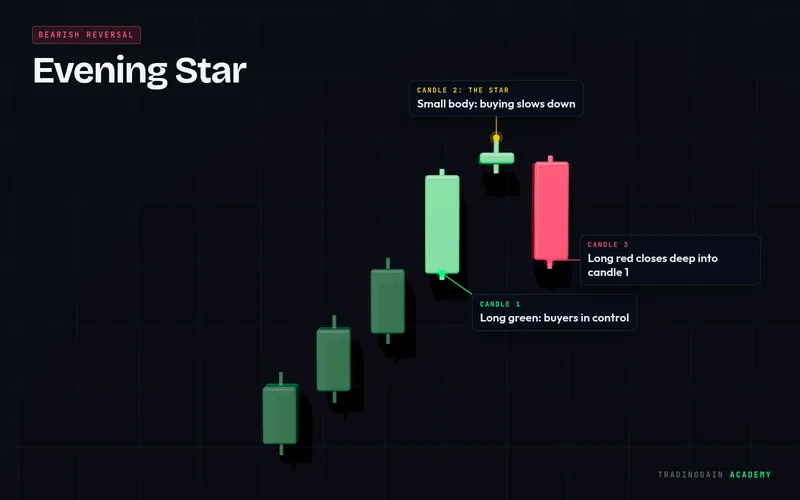
An evening star is a three-candle bearish reversal: a long green candle, a small candle (the star) and then a long red candle that closes well into the first candle.
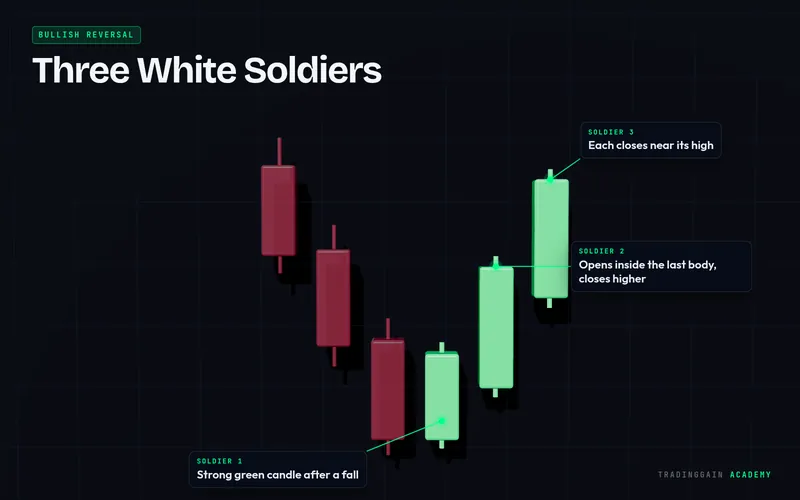
Three white soldiers are three long green candles in a row, each opening inside the previous body and closing near its high.
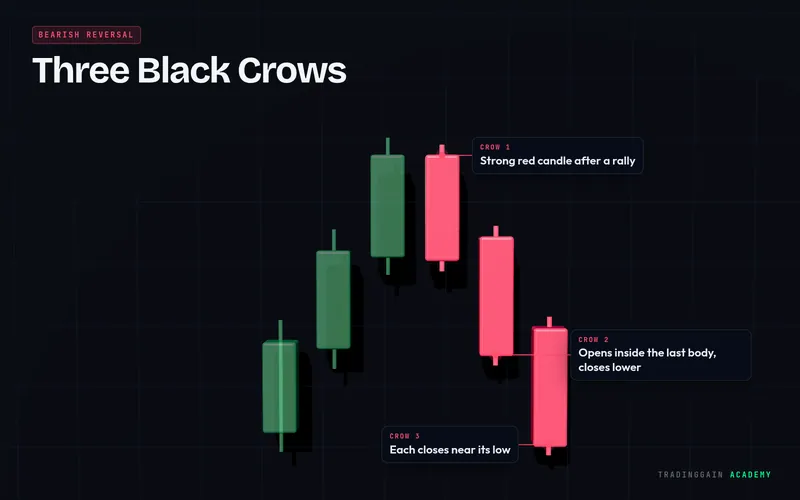
Three black crows are three long red candles in a row, each opening inside the previous body and closing near its low.
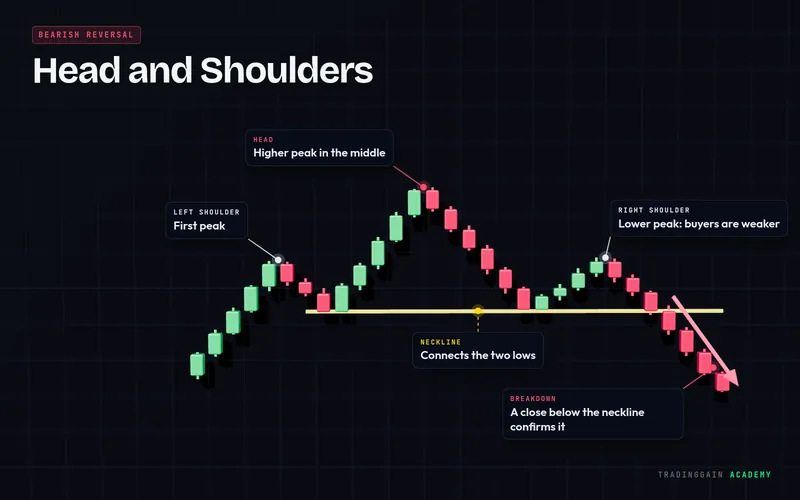
Head and shoulders is a bearish reversal pattern with three peaks: a left shoulder, a higher head in the middle and a lower right shoulder. A neckline connects the lows between them.
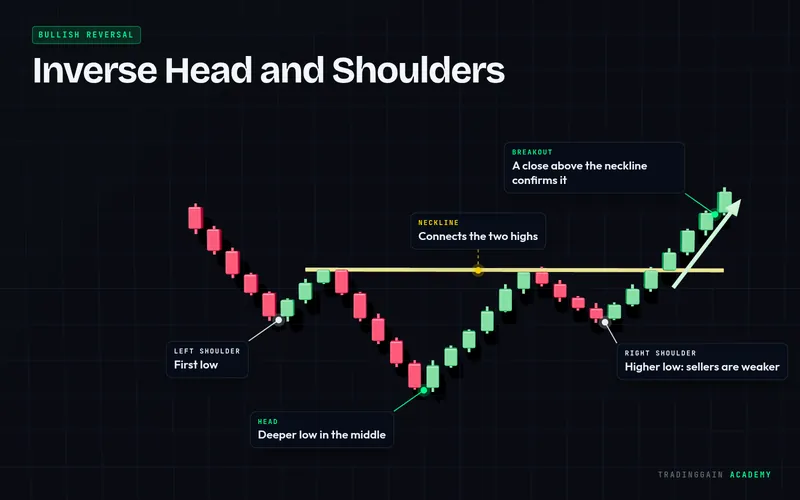
Inverse head and shoulders is a bullish reversal pattern with three lows: a left shoulder, a deeper head in the middle and a higher right shoulder, with a neckline across the highs.
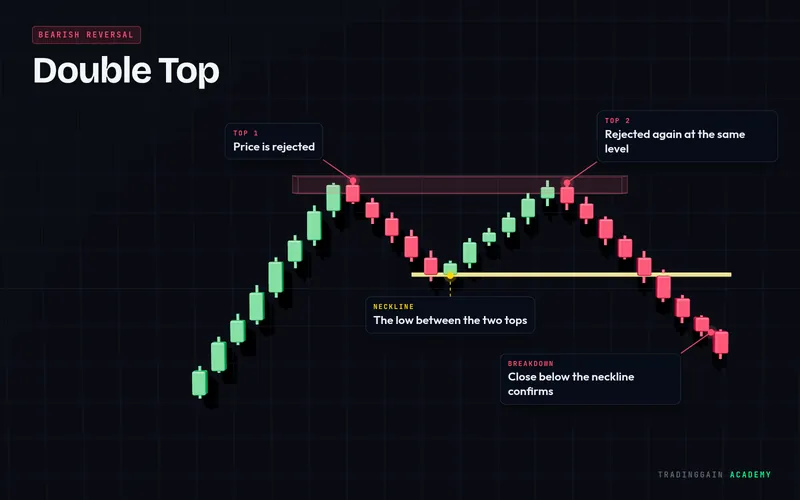
A double top is a bearish reversal pattern where price reaches the same high twice and fails both times, forming an M shape.
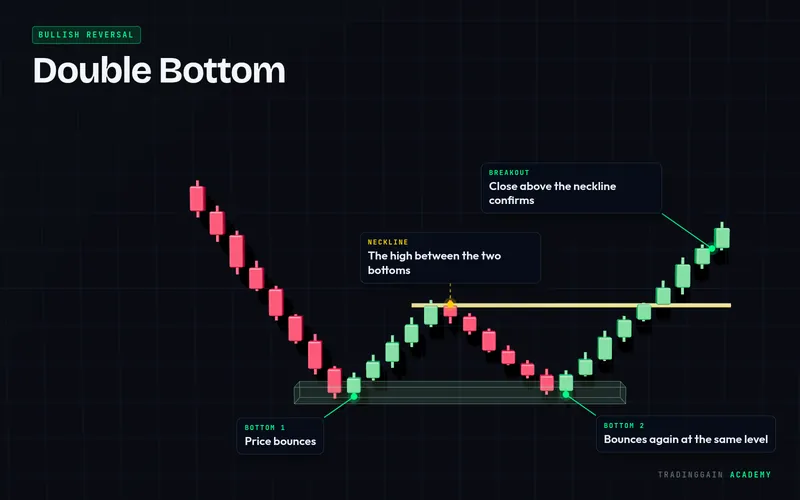
A double bottom is a bullish reversal pattern where price falls to the same low twice and bounces both times, forming a W shape.
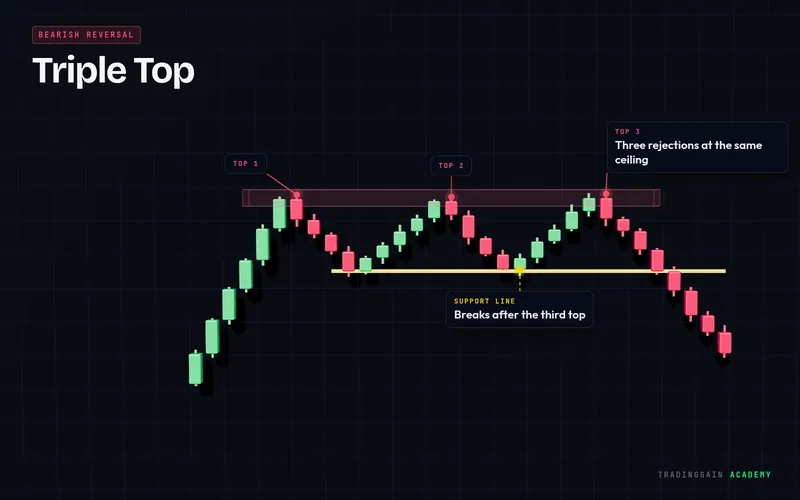
A triple top is a bearish reversal pattern where price tests the same resistance three times and fails each time.

A triple bottom is a bullish reversal pattern where price tests the same support three times and holds each time.
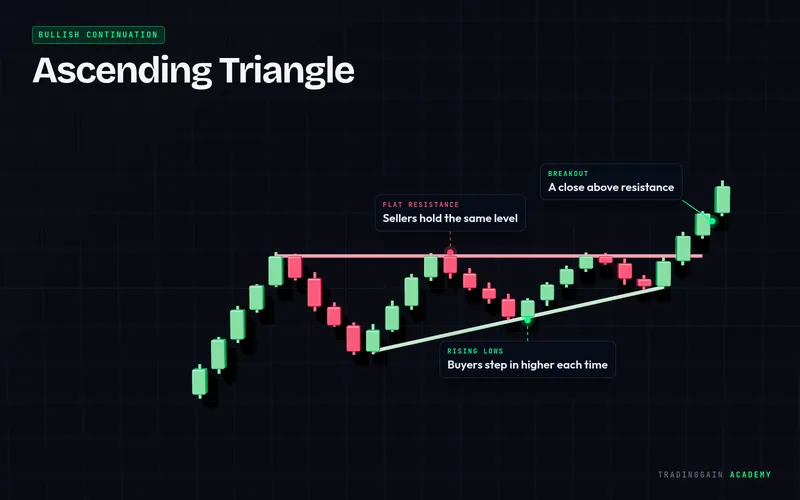
An ascending triangle is a pattern with a flat resistance line on top and a rising trendline underneath. Buyers keep stepping in higher while sellers hold one level.
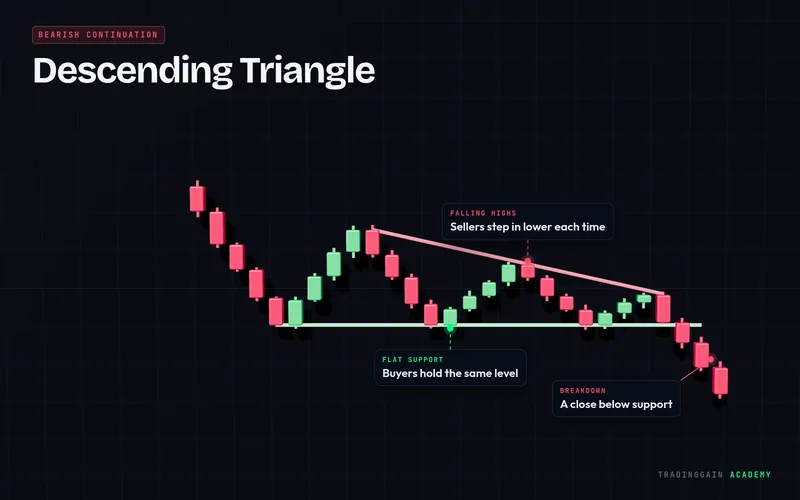
A descending triangle is a pattern with a flat support line at the bottom and a falling trendline on top. Sellers keep stepping in lower while buyers hold one level.
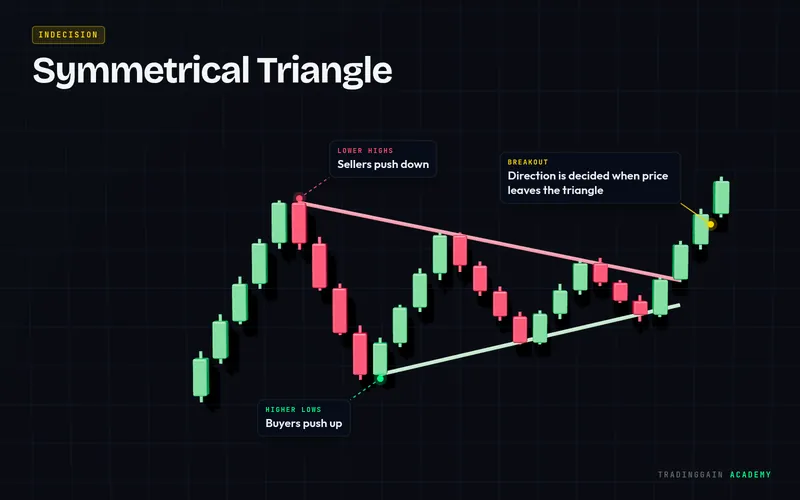
A symmetrical triangle is a pattern where highs get lower and lows get higher, so two trendlines come together. Neither side is in control until price breaks out.
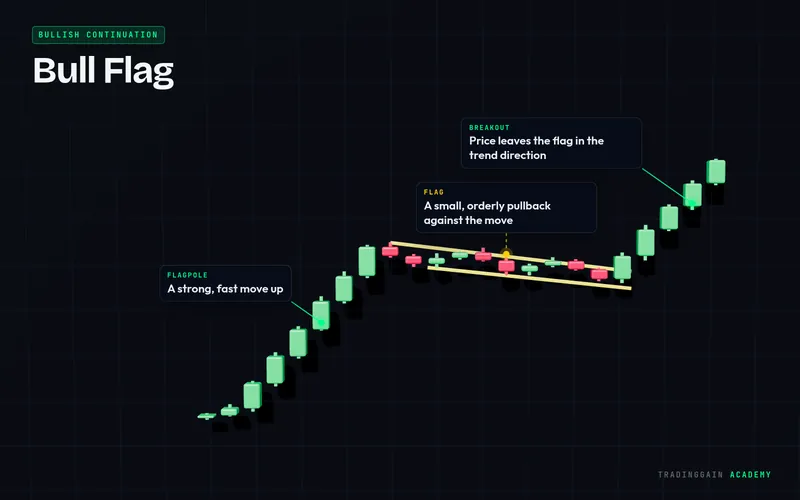
A bull flag is a continuation pattern: a sharp move up (the flagpole) followed by a small pullback inside a downward-sloping channel (the flag).
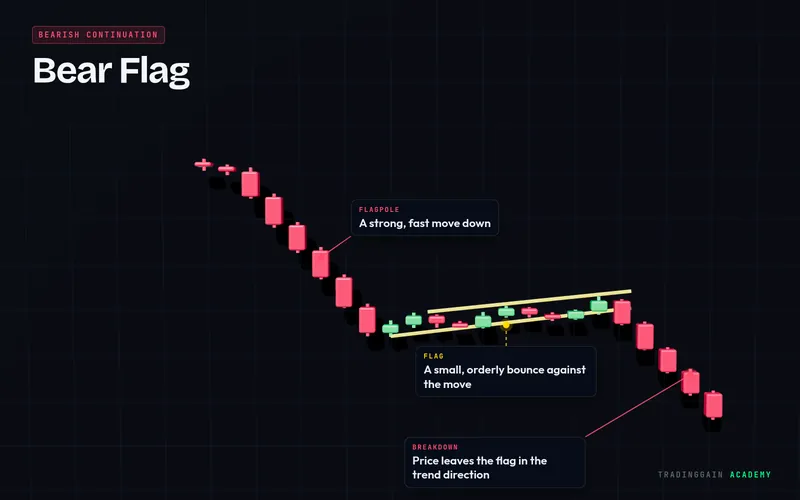
A bear flag is a continuation pattern: a sharp move down (the flagpole) followed by a small bounce inside an upward-sloping channel (the flag).
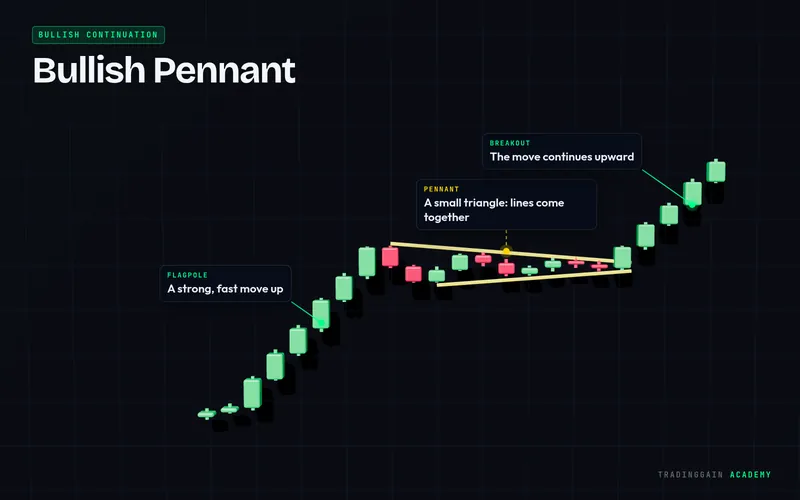
A bullish pennant is a continuation pattern: a strong move up (the pole) followed by a small symmetrical triangle (the pennant) before the trend continues.
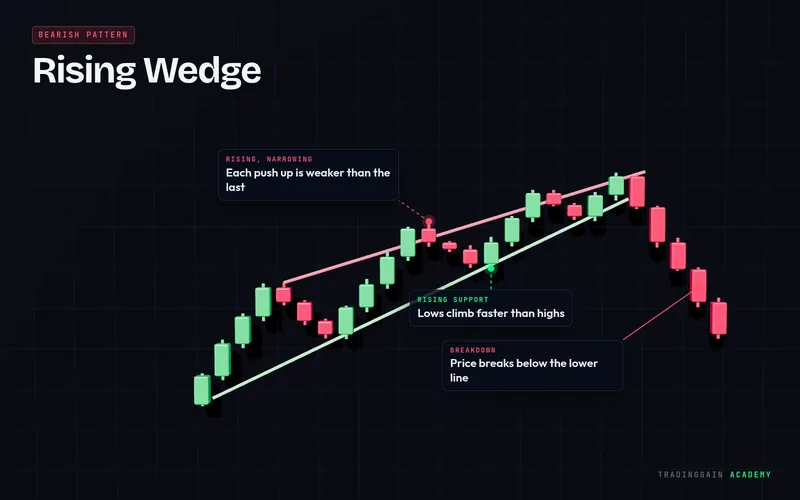
A rising wedge is a pattern where price moves up between two rising lines that come closer together. Each push up gains less ground, and the pattern usually breaks down.
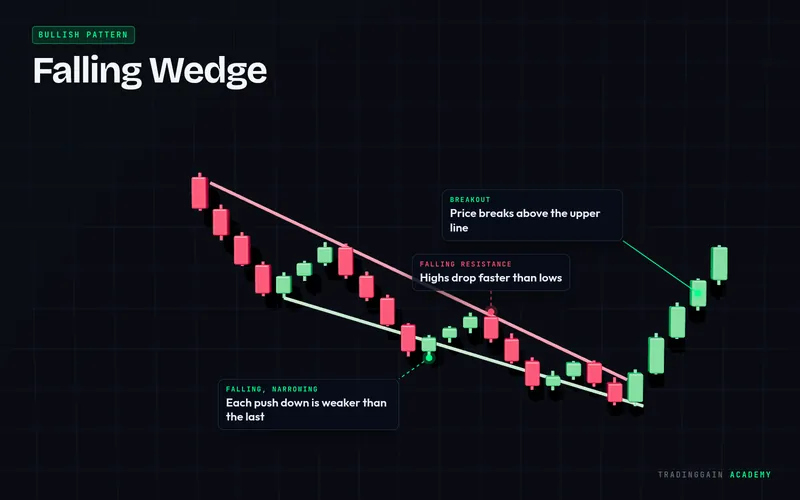
A falling wedge is a pattern where price moves down between two falling lines that come closer together. Each push down gains less ground, and the pattern usually breaks up.
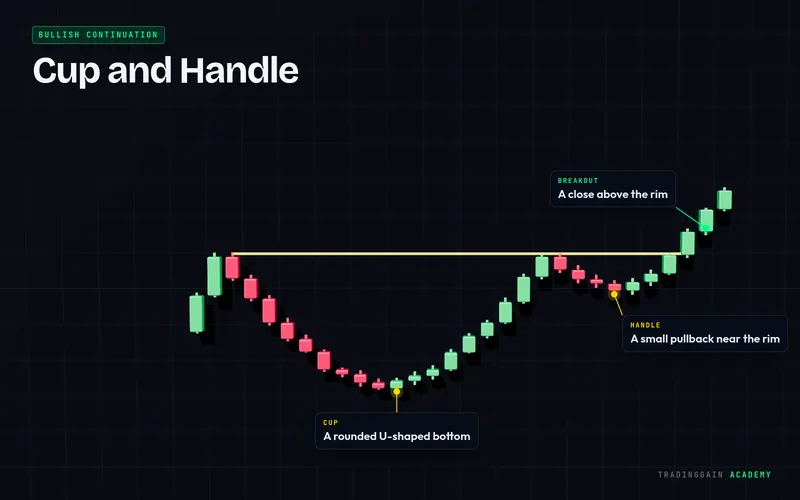
Cup and handle is a bullish pattern with a rounded, U-shaped bottom (the cup) followed by a small pullback near the top (the handle), before a breakout above the rim.
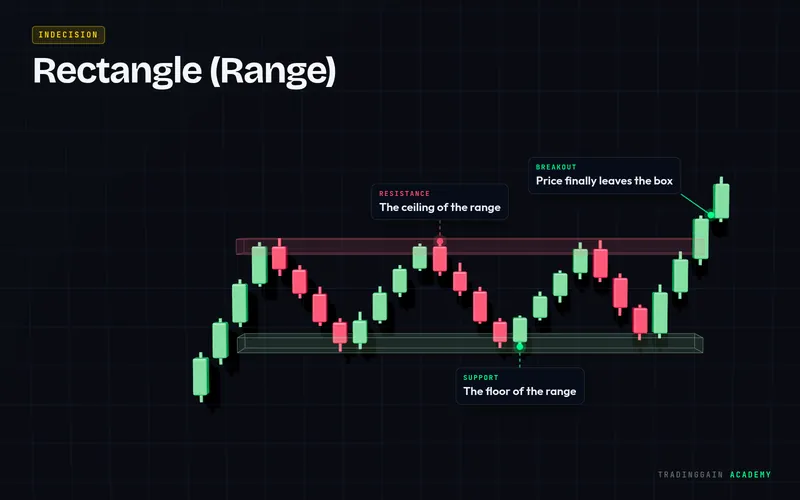
A rectangle, also called a trading range, is when price moves sideways between a flat support and a flat resistance.
Candlestick patterns are shapes made by one to three candles that show a shift in the balance between buyers and sellers, such as a hammer, a doji or a bullish engulfing.
Candlestick patterns use one to three candles and give short-term signals. Chart patterns, such as head and shoulders or triangles, form over many candles and describe the bigger structure of the market.
No pattern works every time. Patterns such as the bullish and bearish engulfing or the morning and evening star are widely watched, and any pattern is more reliable at a strong support or resistance level, with higher volume and with confirmation.
Yes. The patterns describe how buyers and sellers behave, so they appear on crypto, stock, forex and gold charts on every timeframe.
Put each concept to work inside the TradingGain app, without risking real money.