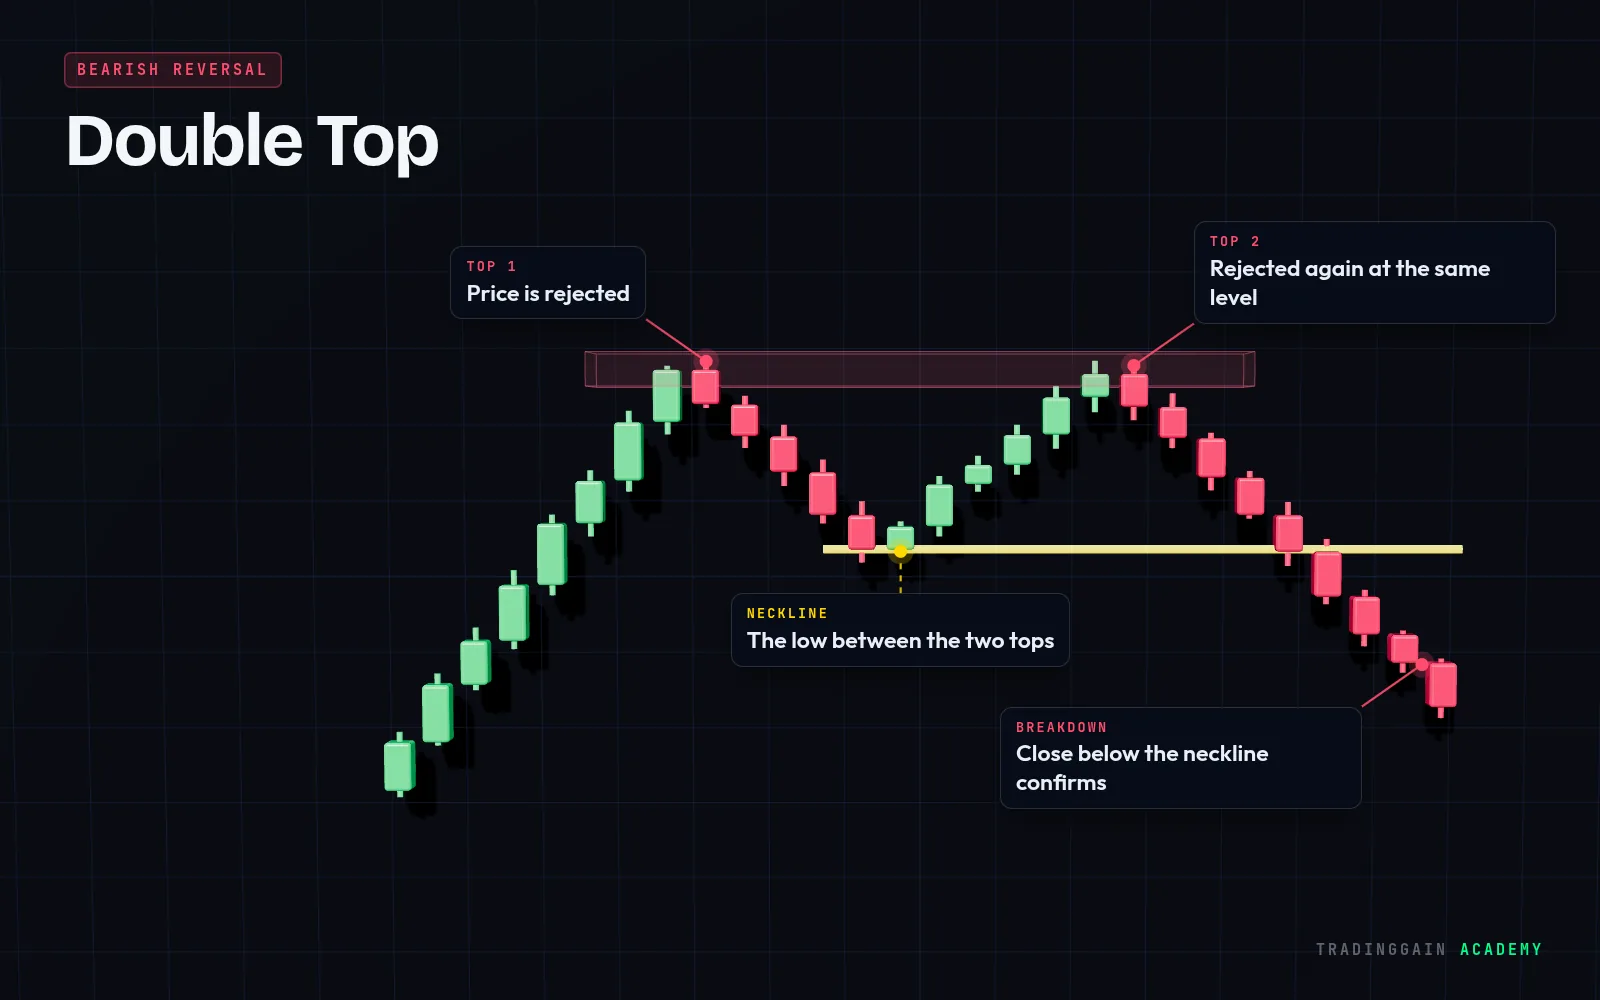
How to spot a Double Top
- Forms after an uptrend
- Two peaks at roughly the same level
- A pullback low between them forms the neckline
- Completes on a close below the neckline
What the Double Top tells you
The second failure at the same level shows that sellers are defending it firmly. Once the neckline breaks, the market has made a lower low and the uptrend is in doubt.
How traders use it
- Enter short on a close below the neckline or on its retest
- Place the stop above the second top
- A common target is the height of the pattern projected down from the neckline
Common mistakes
- Calling it a double top before the neckline breaks
- Not noticing when the second top is only a liquidity sweep of the first
- Ignoring the higher-timeframe trend
 See it on a real chart · EP 02Support & Resistance: How to Draw ThemWatch the free lesson →
Questions about the Double Top
Is a double top bearish?
Yes. A double top signals a possible reversal from up to down, and it is confirmed when price closes below the neckline.
How is a double top different from a triple top?
A double top has two failed peaks. A triple top has three, and usually takes longer to form.
For education only, not financial advice. The chart is an illustration of the pattern, not real market data. No pattern works every time; always use a stop-loss.