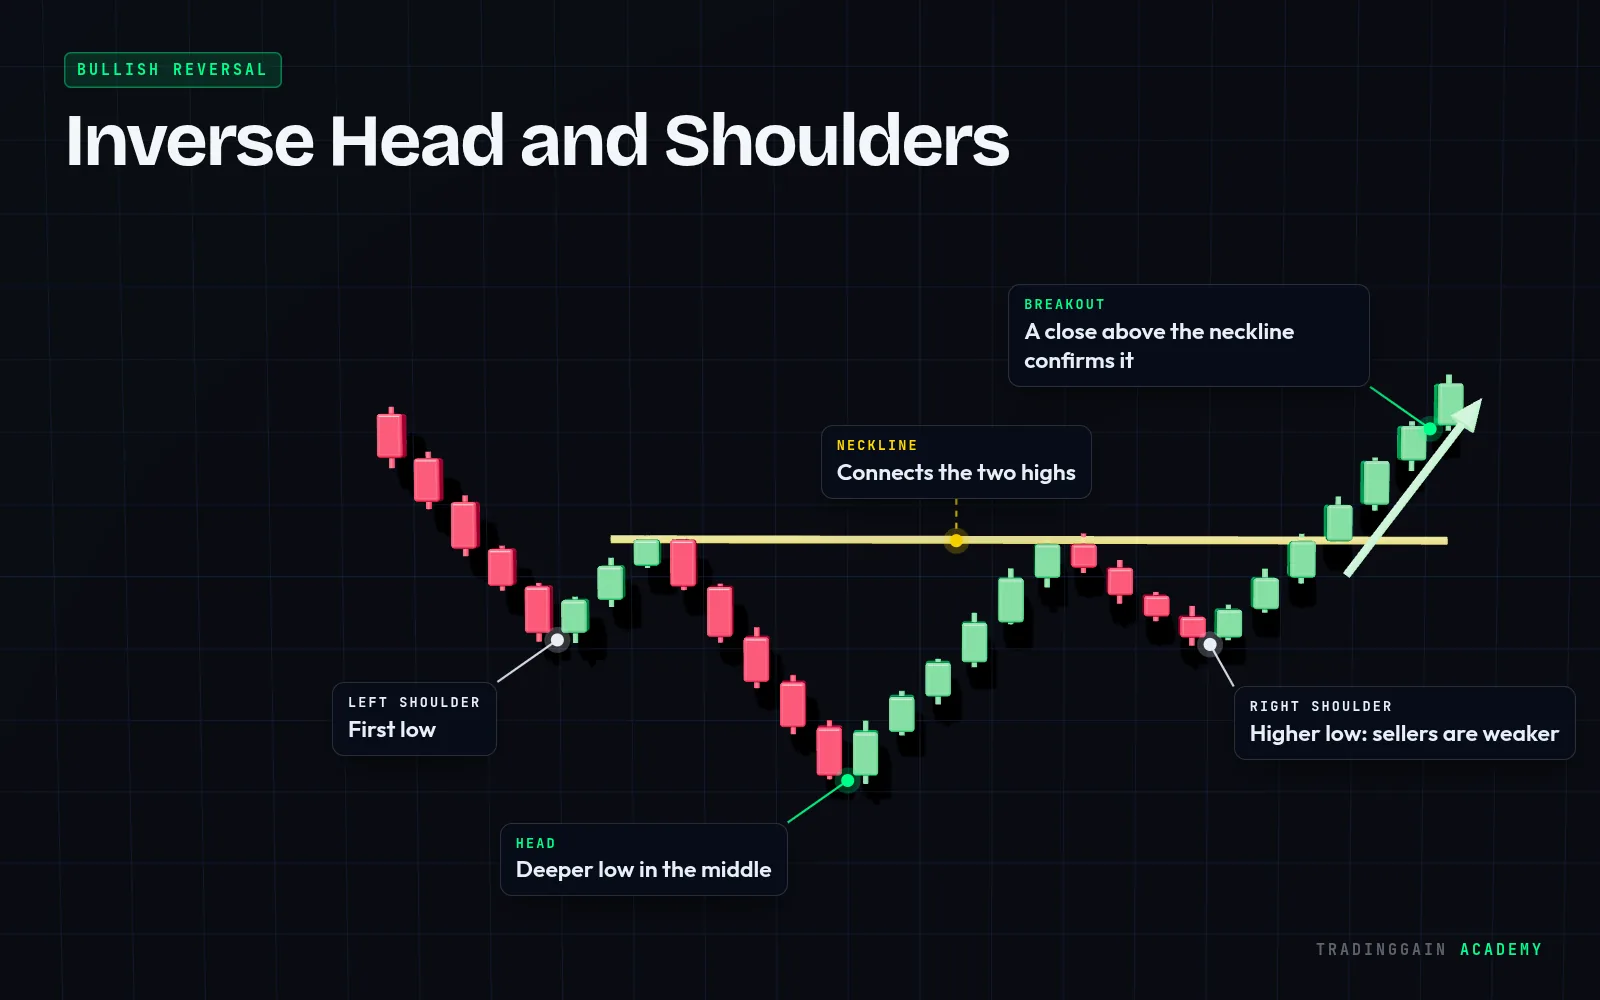
How to spot a Inverse Head and Shoulders
- Forms after a downtrend
- Left shoulder, then a deeper low (head), then a higher low (right shoulder)
- A neckline joins the two highs between the lows
- Completes when price closes above the neckline
What the Inverse Head and Shoulders tells you
The head is the last lower low. The higher right shoulder shows sellers losing strength, and the neckline break confirms the downtrend structure has broken.
How traders use it
- Enter long on a close above the neckline, or on a retest from above
- Place the stop below the right shoulder
- A common target is the height from head to neckline, projected up from the breakout
- Risk only a small, fixed part of your account on the trade.
Common mistakes
- Buying before the neckline breaks
- Ignoring a downward-sloping neckline, which is weaker
- No volume on the breakout
 See it on a real chart · EP 04Market Structure: HH, HL, LH and LLWatch the free lesson →
Questions about the Inverse Head and Shoulders
Is inverse head and shoulders bullish?
Yes. It is a bullish reversal pattern that signals a possible end of a downtrend once the neckline breaks.
Where do you put the stop on an inverse head and shoulders?
A common place is below the right shoulder, which is the last higher low before the breakout.
For education only, not financial advice. The chart is an illustration of the pattern, not real market data. No pattern works every time; always use a stop-loss.