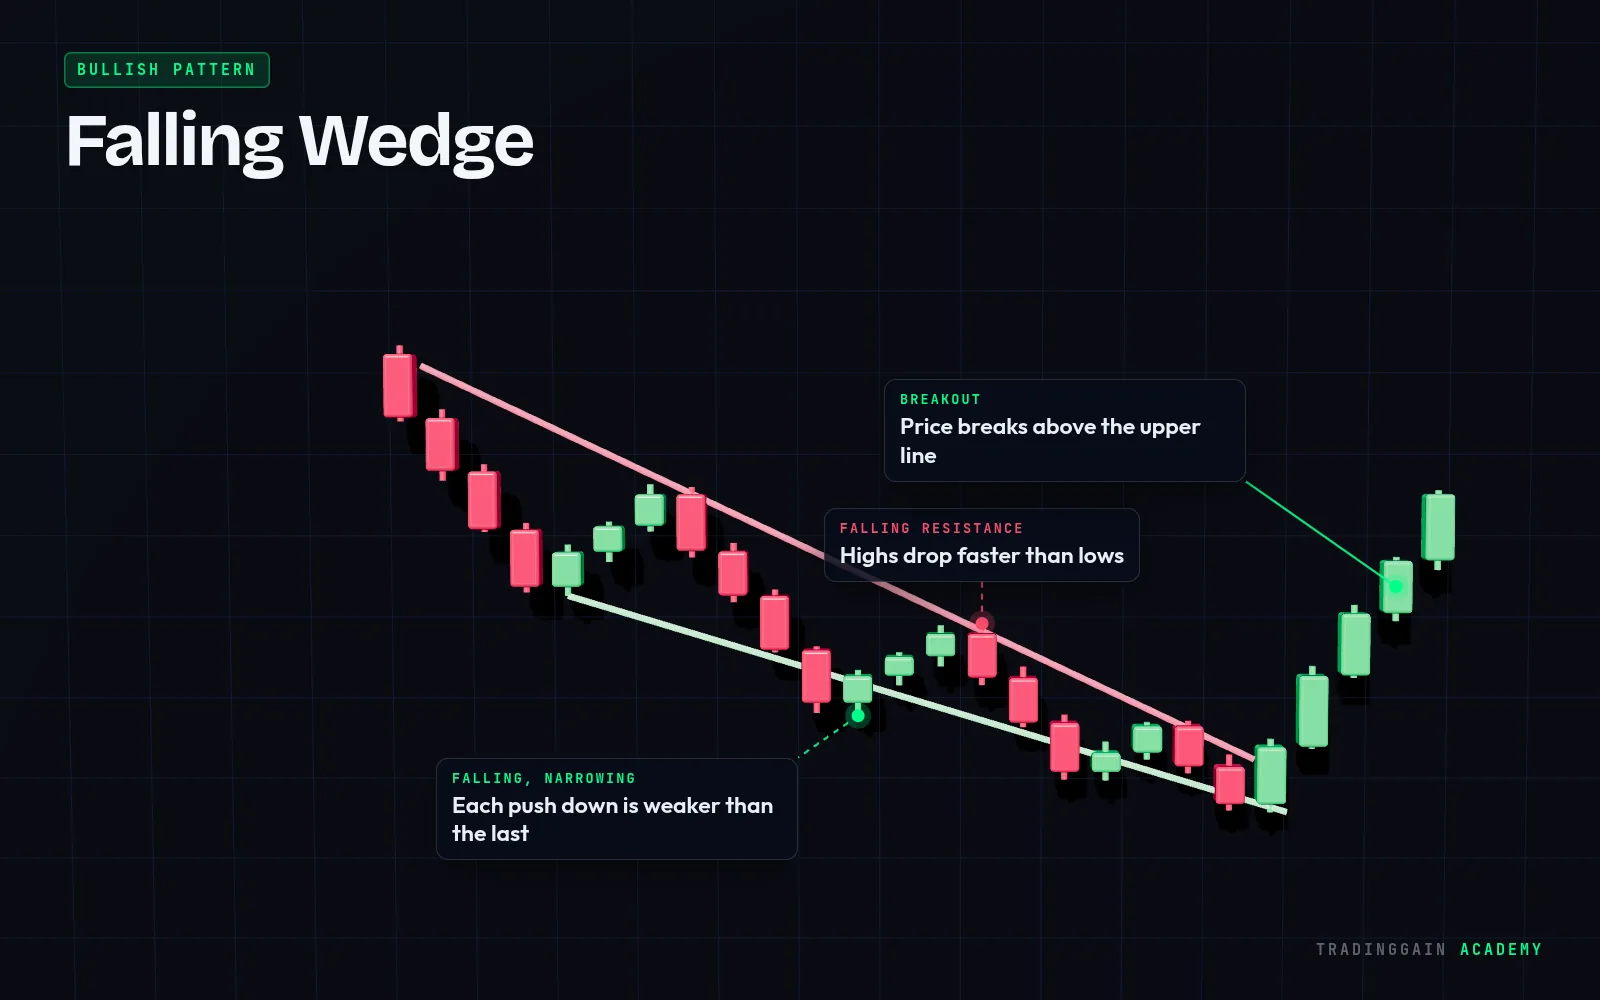
How to spot a Falling Wedge
- Two falling trendlines that converge
- Highs and lows both fall, but the drop gets weaker
- Often appears at the end of a downtrend or as a pullback in an uptrend
- Breaks up through the upper line
What the Falling Wedge tells you
Sellers are still in control, but each new low comes with less force. A break above the upper line shows buyers taking over.
How traders use it
- Enter long on a close above the upper line
- Place the stop below the last low inside the wedge
- A common target is the start of the wedge
Common mistakes
- Buying inside the wedge before the breakout
- Confusing it with a descending channel
- No stop-loss
 See it on a real chart · EP 03Trend and Trendlines: How to Draw ThemWatch the free lesson →
Questions about the Falling Wedge
Is a falling wedge bullish?
Yes. It is usually a bullish pattern, because selling momentum fades as the lines converge.
Falling wedge vs descending triangle?
A descending triangle has a flat bottom and is usually bearish. A falling wedge has both lines sloping down and is usually bullish.
For education only, not financial advice. The chart is an illustration of the pattern, not real market data. No pattern works every time; always use a stop-loss.