// Definition
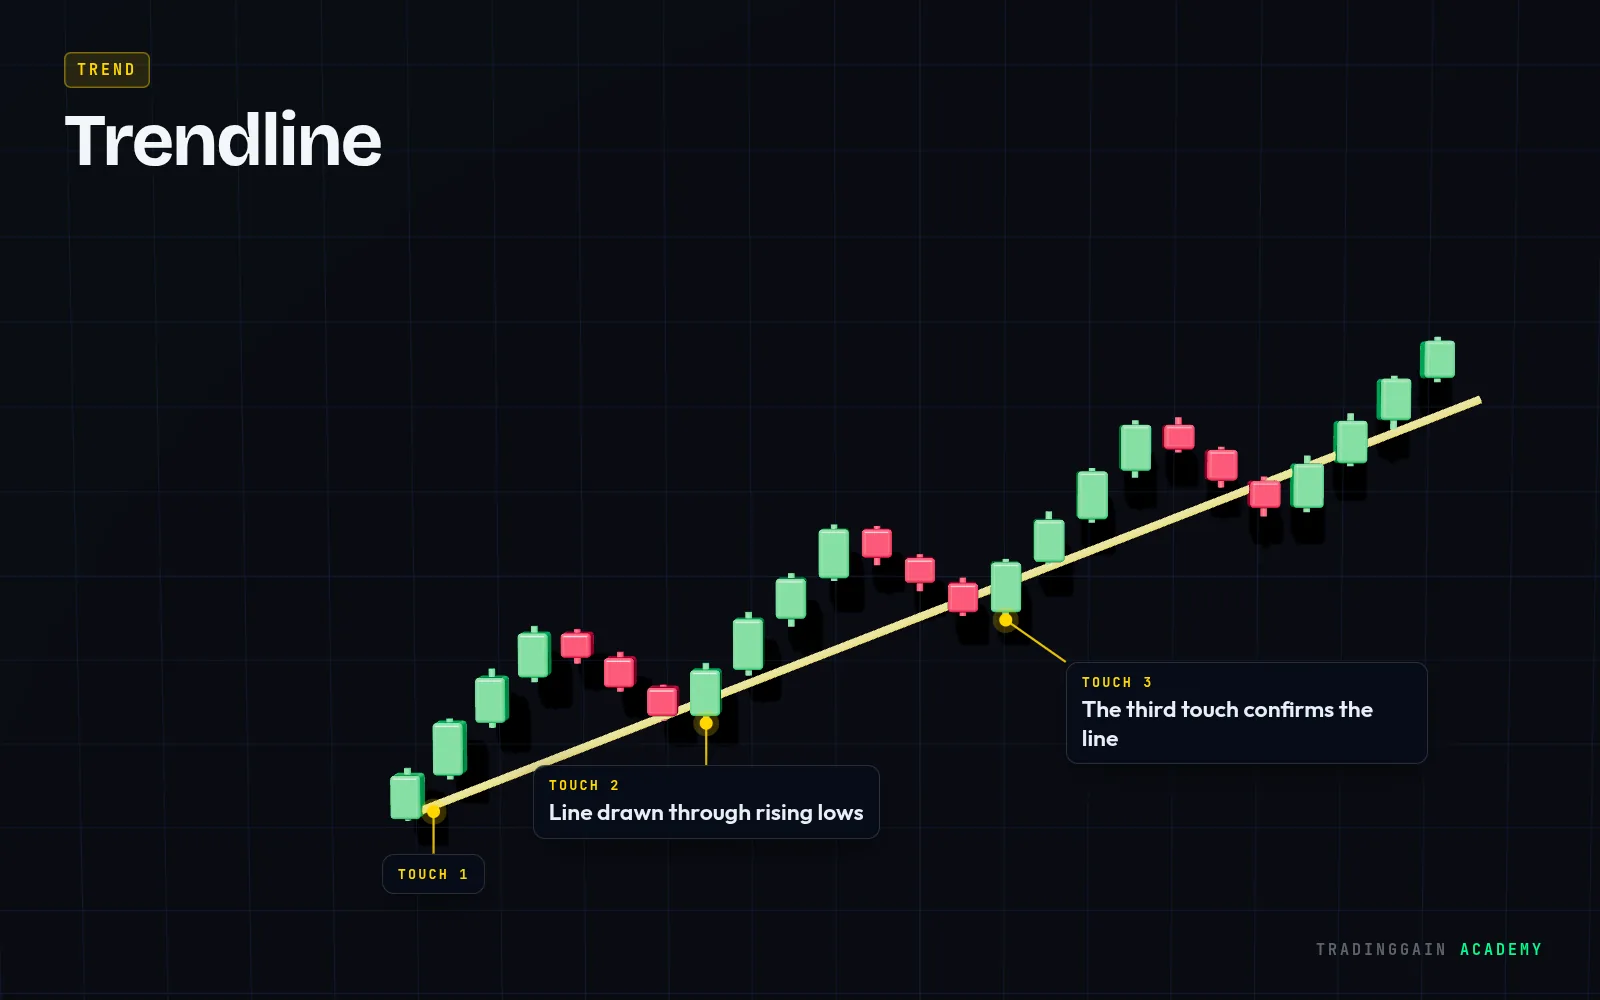
A trendline is a straight line drawn through the lows of an uptrend or the highs of a downtrend, showing the path price has been respecting.
Explained simply
In an uptrend you connect two or more higher lows; in a downtrend you connect two or more lower highs. The line then acts as a moving support or resistance.
A trendline becomes more meaningful each time price touches it and reacts. A break of the line is a warning that the trend may be weakening, not proof that it has reversed.
Tip
Two touches draw a line, the third touch confirms it. Do not force a line through candles just to make it fit.
 Learn it on a real chart · EP 03Trend and Trendlines: How to Draw ThemWatch the free lesson →
For education only, not financial advice. Trading is risky and you can lose money.