// Definition
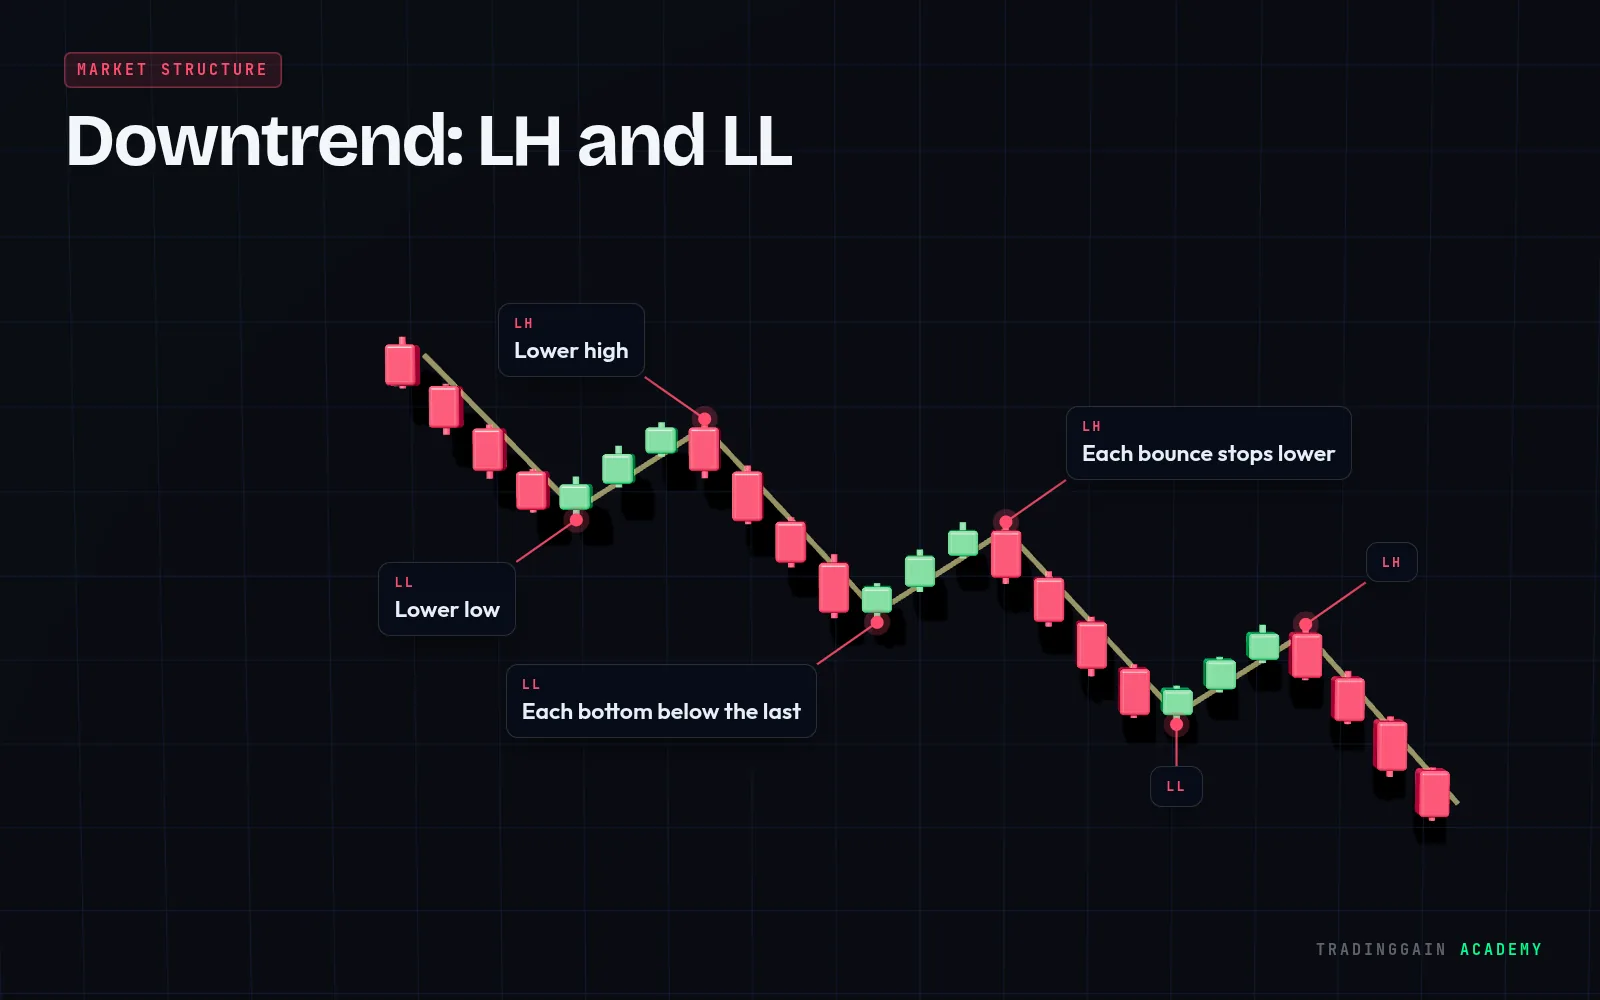
A downtrend is a market that keeps making lower highs and lower lows.
Explained simply
Each bounce stops below the previous peak, and each drop goes below the previous low. It looks like a staircase going down.
A downtrend stays intact as long as price keeps failing at lower highs. A clear break above the most recent lower high is the first sign the downtrend may be ending.
Tip
Buying in a downtrend because price "looks cheap" is one of the most common beginner mistakes.
 Learn it on a real chart · EP 03Trend and Trendlines: How to Draw ThemWatch the free lesson →
For education only, not financial advice. Trading is risky and you can lose money.