// Definition
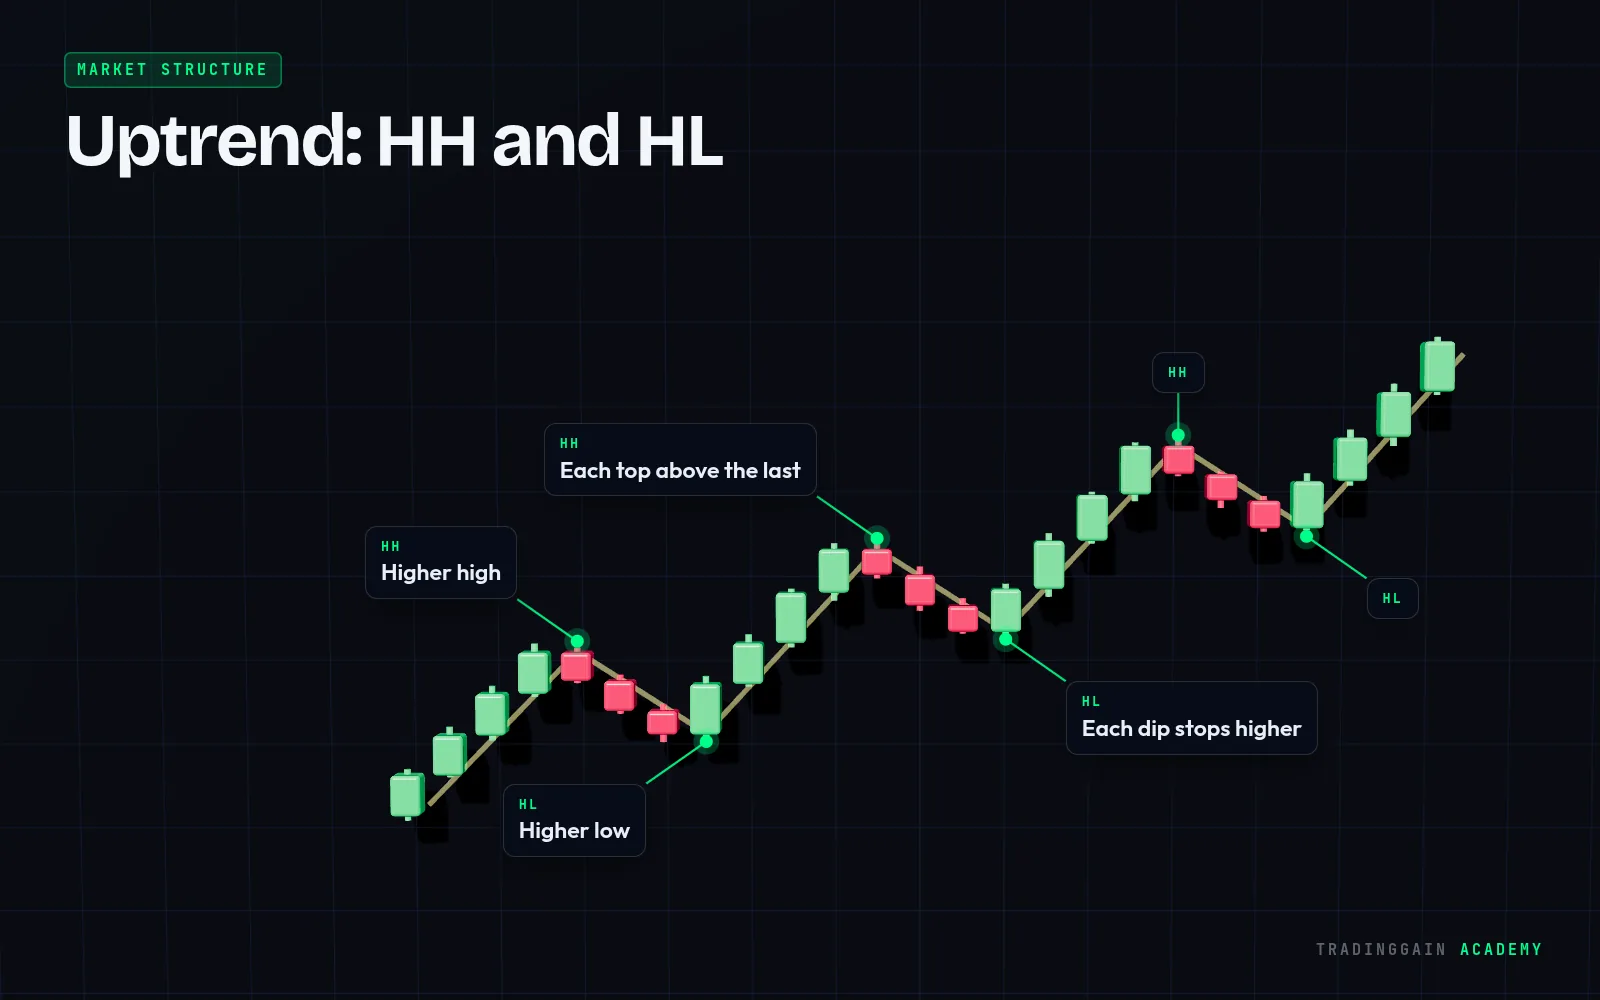
An uptrend is a market that keeps making higher highs and higher lows.
Explained simply
Each new peak is above the previous one, and each pullback stops above the previous low. It looks like a staircase going up.
An uptrend stays intact as long as price keeps respecting its higher lows. A clear break below the most recent higher low is the first warning that the uptrend may be ending.
Tip
In an uptrend, look for buying opportunities at higher lows, not for tops to sell.
 Learn it on a real chart · EP 03Trend and Trendlines: How to Draw ThemWatch the free lesson →
For education only, not financial advice. Trading is risky and you can lose money.