// Definition
Market structure is the pattern of highs and lows on a chart that shows whether the market is trending up, trending down or ranging.
Explained simply
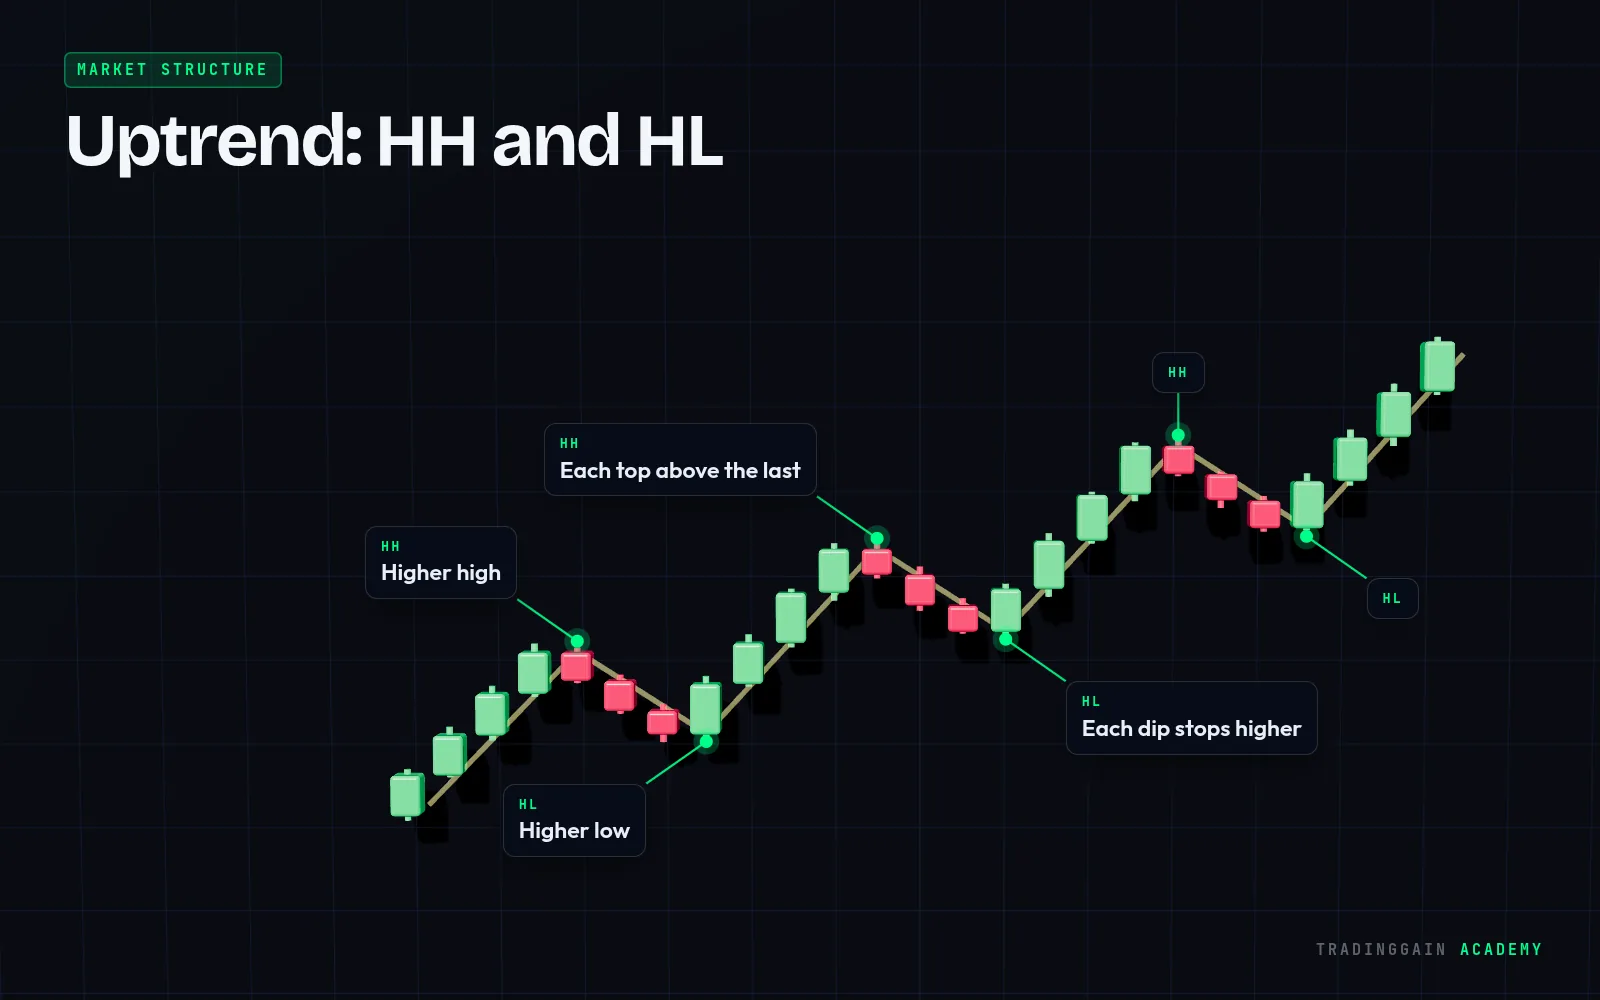
Reading structure means labelling the swing highs and swing lows: higher highs and higher lows mean an uptrend, lower highs and lower lows mean a downtrend, and overlapping highs and lows mean a range.
Structure is one of the most reliable ways to identify the trend, because it is based purely on what price has actually done.
Tip
Read structure on the higher timeframe first. The 15-minute structure can point the other way to the 4-hour structure.
 Learn it on a real chart · EP 04Market Structure: HH, HL, LH and LLWatch the free lesson →
For education only, not financial advice. Trading is risky and you can lose money.