// Definition
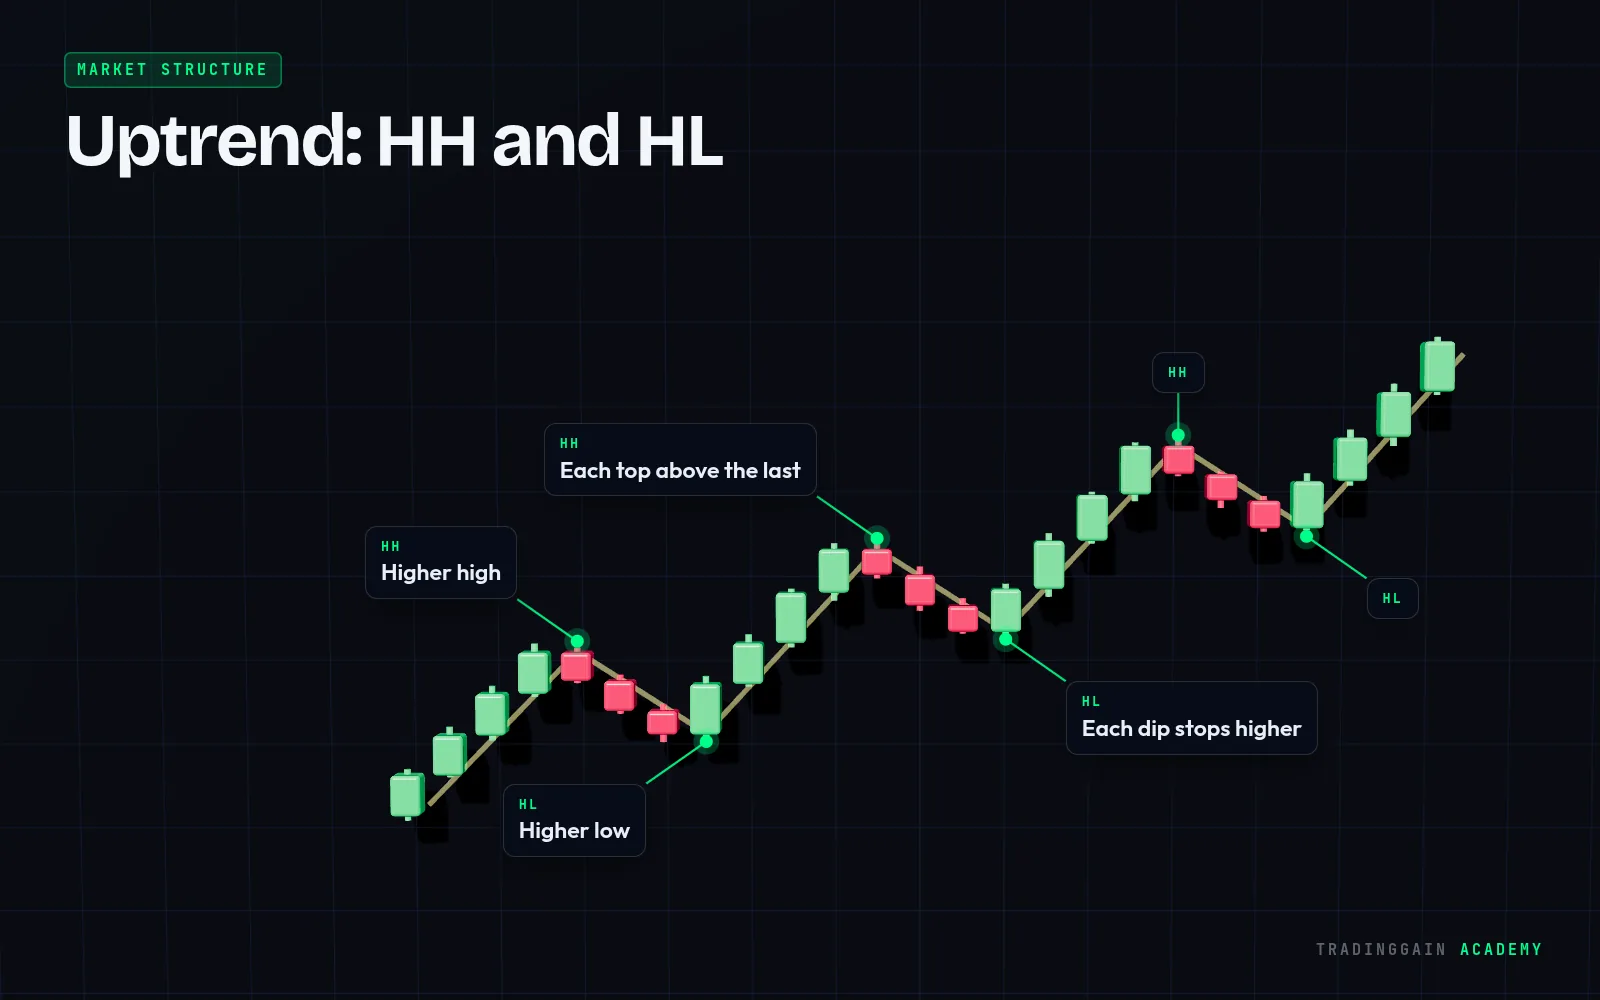
A swing low is a dip on the chart where price turned up, with higher lows on both sides of it.
Explained simply
Swing lows are the bottoms of the waves in price movement. Comparing one swing low with the previous one tells you whether the market is making higher lows or lower lows.
Many traders place stop-losses just below swing lows, so these points often hold a lot of liquidity.
Tip
In an uptrend, the most recent swing low is the line in the sand. A close below it is the first warning.
 Learn it on a real chart · EP 04Market Structure: HH, HL, LH and LLWatch the free lesson →
For education only, not financial advice. Trading is risky and you can lose money.