// Definition
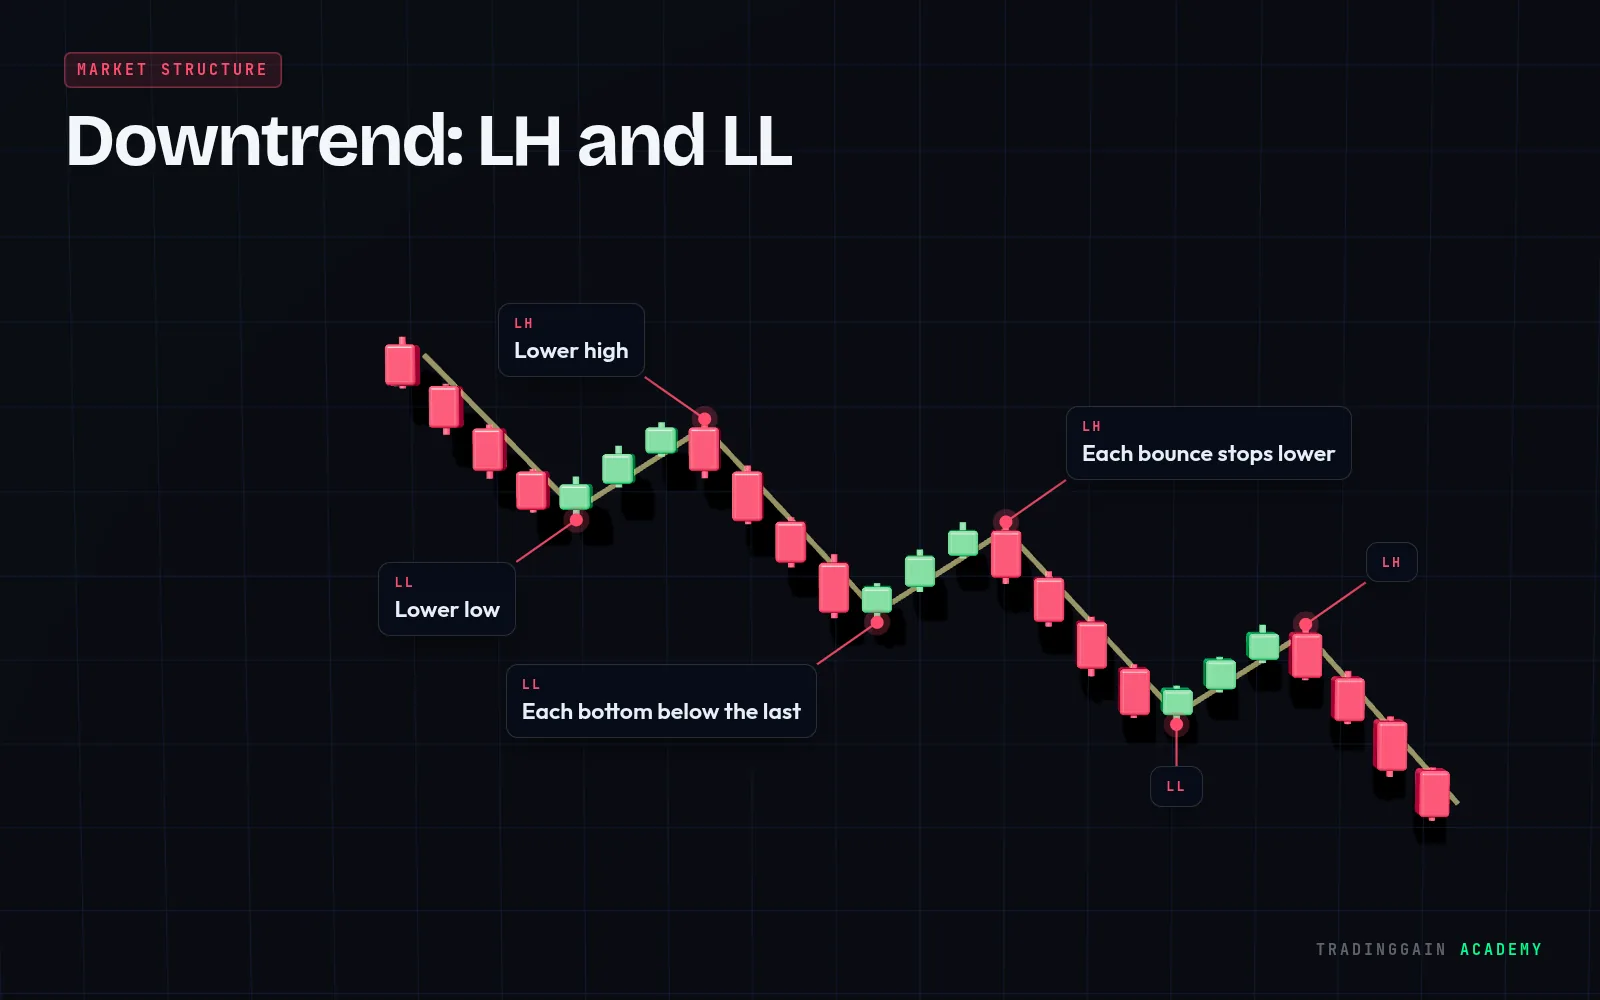
A lower high is a rally that stops below the previous peak. A series of lower highs is a sign of a downtrend.
Explained simply
When sellers are in control, each bounce runs out of strength before it reaches the previous top. That weaker top is a lower high.
After an uptrend, the first lower high is an important warning: buyers could not push to a new high. Combined with a broken higher low, it often marks a change in trend.
Tip
In a downtrend, lower highs are where sellers tend to step in, so they make natural areas to look for short entries.
 Learn it on a real chart · EP 04Market Structure: HH, HL, LH and LLWatch the free lesson →
For education only, not financial advice. Trading is risky and you can lose money.