What you will learn
- How to tell an uptrend from a downtrend using structure
- What Higher High, Higher Low, Lower High and Lower Low mean, and why they form
- How to find swing points on a chart
- A downtrend on Ethereum 4H and an uptrend on Bitcoin 1H
- Structure breaks and Change of Character on Bitcoin 4H
- A backtest: when structure worked and when it failed
- An entry, stop-loss and target example at a Higher Low
- 3 mistakes beginners make
What is market structure?
Market structure is the most reliable way to tell whether a trend is still alive or has ended. It is written on every chart in four short labels: HH, HL, LH and LL.
Think of a staircase. In an uptrend, every new top is above the previous top. That is a Higher High (HH). Every pullback also stops above the previous one. That is a Higher Low (HL). A downtrend is the same staircase going down: every top is a Lower High (LH) and every bottom is a Lower Low (LL).
Why does structure form?
In an uptrend, buyers believe price will keep rising, so they do not wait for a full pullback and buy early. That is why each low ends up higher than the last. In a downtrend, sellers do the same thing in reverse, selling every bounce before it reaches the previous top.
Real chart examples
- Ethereum 4H downtrend: each bounce made a Lower High and each drop made a Lower Low, marked step by step on the chart.
- Bitcoin 1H uptrend: a clear zigzag of Higher Highs and Higher Lows, where the uptrend stayed intact as long as the last Higher Low was not broken.
- Bitcoin 4H structure break: on 7 October 2026 a candle closed below the last Higher Low, and price then fell about 4.5%. The next bounce failed to make a new high and formed a Lower High. That shift from higher highs to lower highs is called a Change of Character.
A structure break is only the first warning
One broken Higher Low does not prove the trend has reversed. It is the first sign. Confirmation comes when price also fails to make a new high and prints a Lower High. In the lesson's backtest, structure signals were right twice, gave one fake signal, and one was still pending.
How to use structure in a trade
In an uptrend, a Higher Low gives a clear place to plan a trade. The lesson's educational example uses an entry at 83,450, a stop-loss at 83,150 just below the Higher Low, and a target at 84,100, a risk of 300 points for a possible reward of 650.
Patterns from this lesson, in 3D
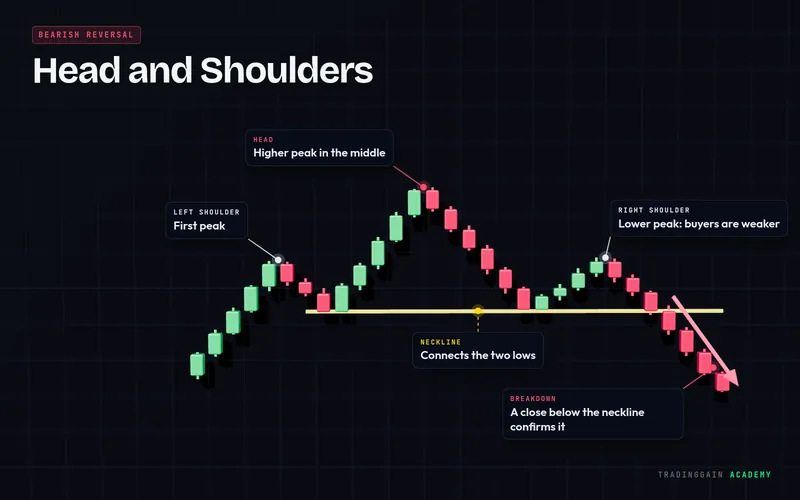
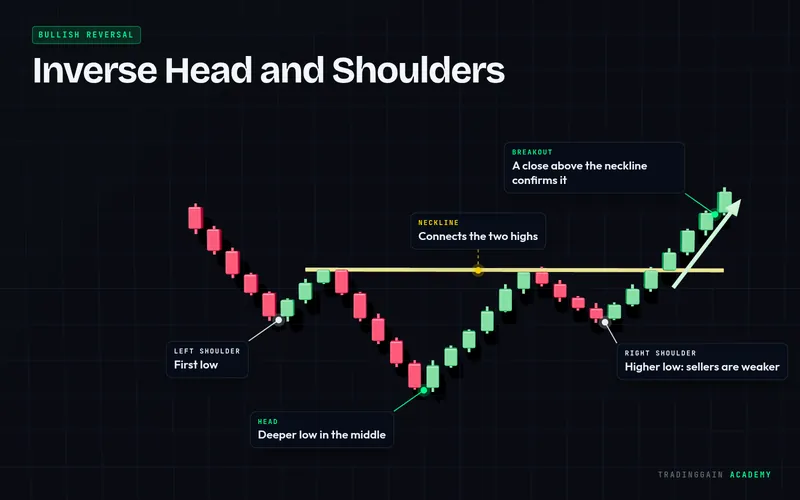
This lesson is for education only and is not financial advice. Trading is risky and you can lose money. Every example uses past market data and does not predict future results.


