// Definition
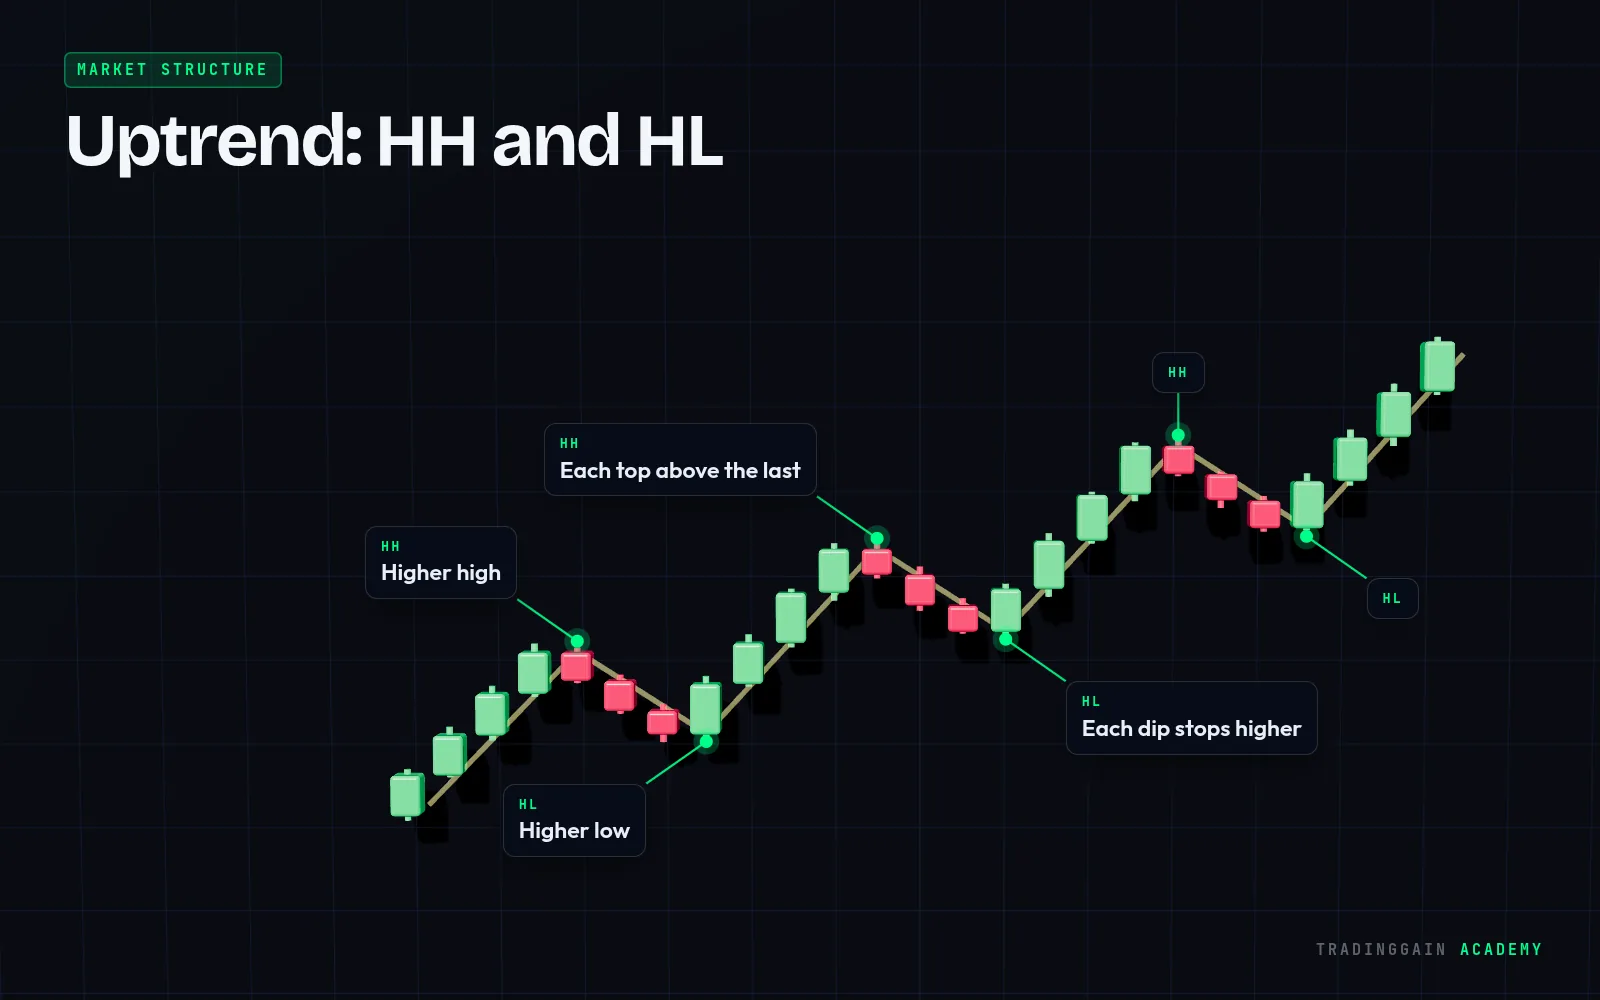
A swing high is a peak on the chart where price turned down, with lower highs on both sides of it.
Explained simply
Swing highs are the tops of the waves in price movement. They are the reference points used to judge market structure: comparing one swing high with the previous one tells you whether the market is making higher highs or lower highs.
Swing highs also tend to collect stop-loss orders from traders who are short, which makes them important liquidity areas.
Tip
Mark only the clear, obvious swings. If you mark every small wiggle, the structure becomes impossible to read.
 Learn it on a real chart · EP 04Market Structure: HH, HL, LH and LLWatch the free lesson →
For education only, not financial advice. Trading is risky and you can lose money.