// Definition
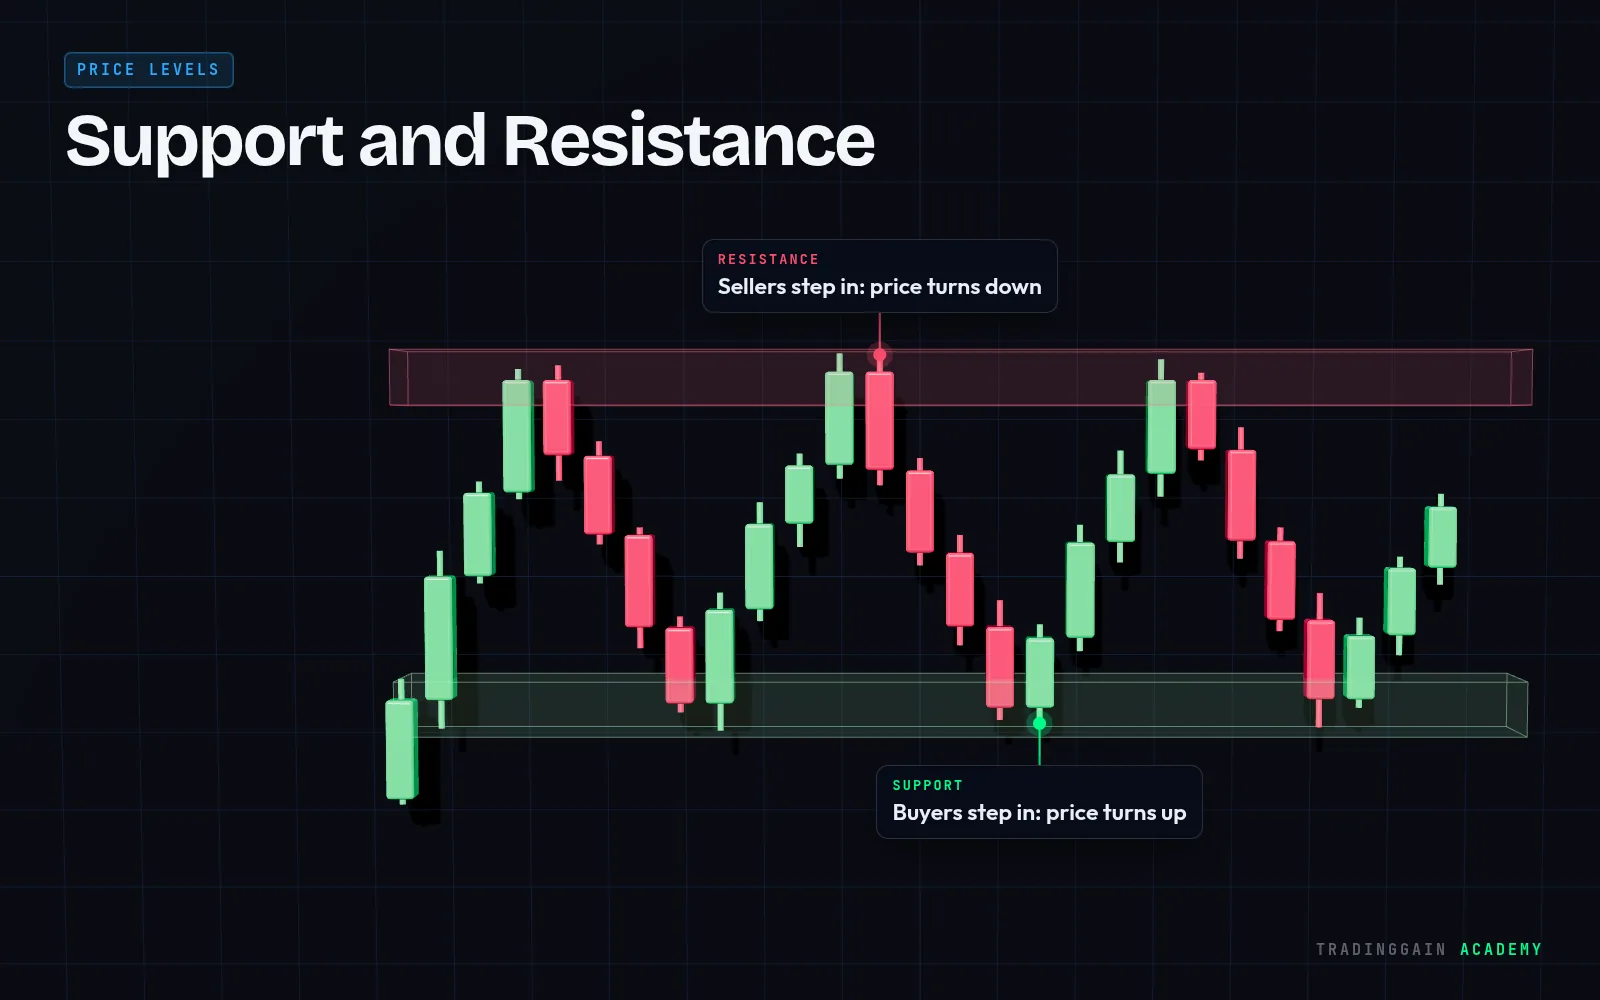
A support or resistance zone is a band of prices, rather than one exact number, where price has repeatedly reacted.
Explained simply
Markets are not precise. Price might turn at 2,770 one day and 2,790 the next. Drawing a zone that covers the whole area of reaction gives a more honest picture than a single line.
A practical way to draw one is to mark the bodies and wicks where price turned, and draw the band between them.
Tip
Thinner zones on lower timeframes, wider zones on higher timeframes. A daily zone is naturally wider than a 15-minute one.
 Learn it on a real chart · EP 02Support & Resistance: How to Draw ThemWatch the free lesson →
For education only, not financial advice. Trading is risky and you can lose money.