// Definition
Resistance is a price area where a rising market tends to stop and turn back down, because sellers step in there.
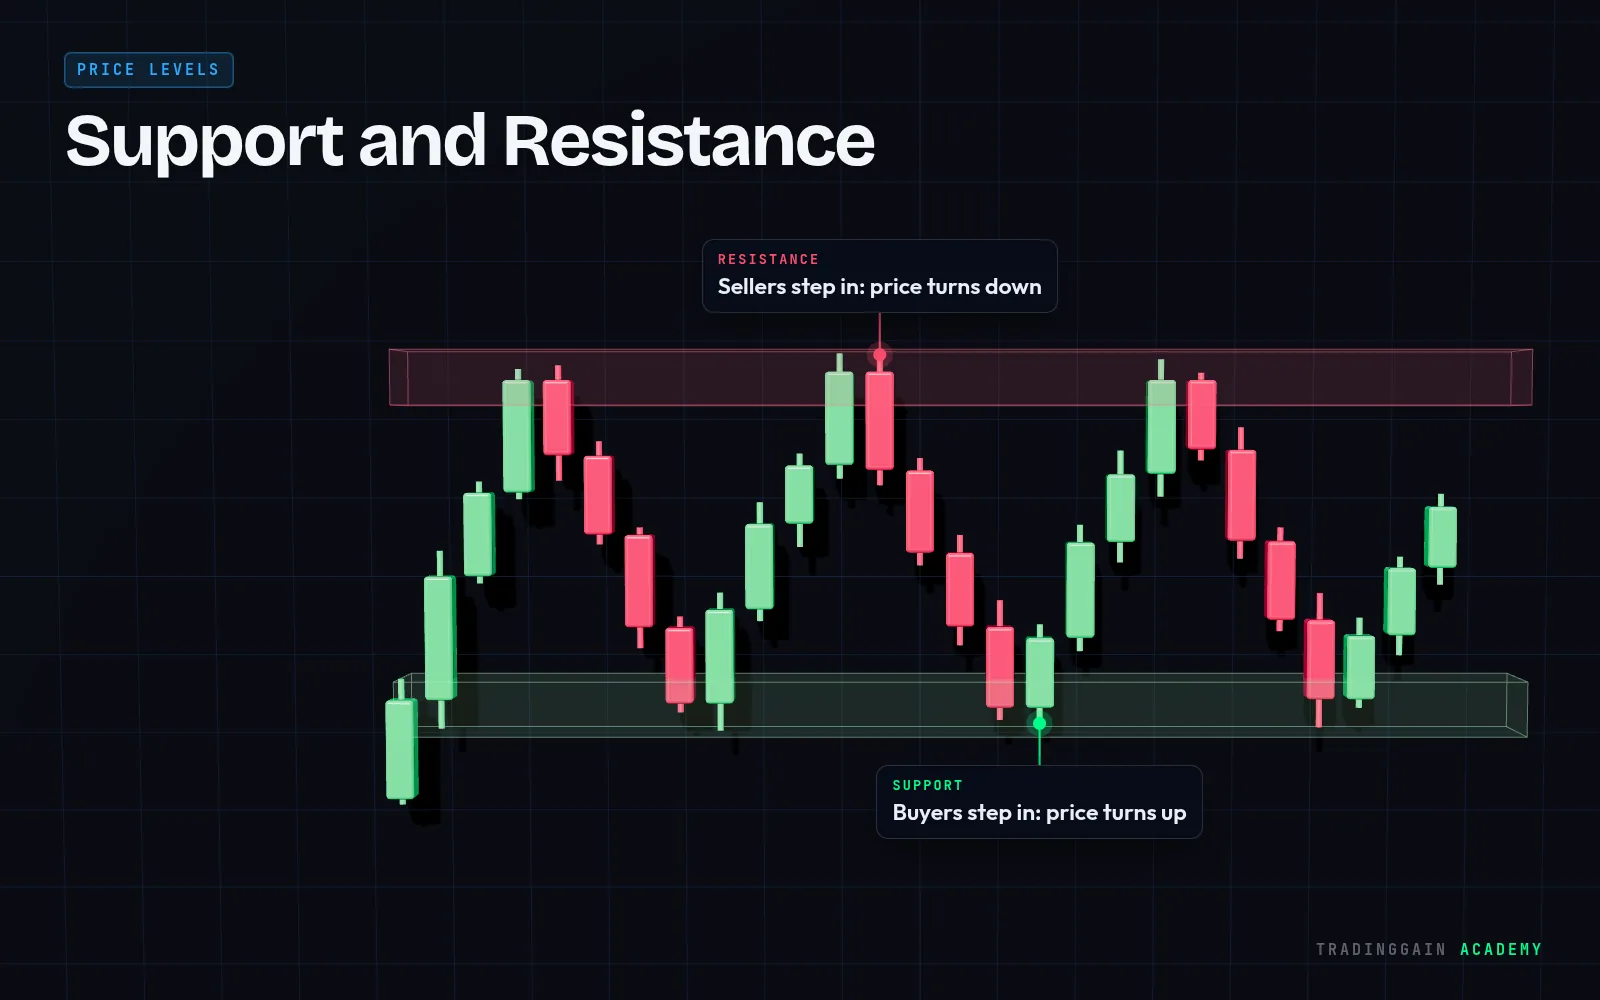
Explained simply
Think of resistance as a ceiling. Each time price rises into that area, selling increases and pushes price back down.
Resistance forms where price has turned down before. Traders who bought there earlier and saw price fall may sell to get out at break-even, adding to the selling pressure.
Tip
The more times price is rejected from the same area, the more important that resistance becomes, and the bigger the move if it finally breaks.
 Learn it on a real chart · EP 02Support & Resistance: How to Draw ThemWatch the free lesson →
For education only, not financial advice. Trading is risky and you can lose money.