What you will learn
- Uptrend, downtrend and sideways, and how to spot each one
- How to draw a trendline in 3 steps
- Why the third touch matters
- What a trendline break really tells you
- How to plan a trade with entry, stop-loss and target
- 3 mistakes beginners make with trendlines
What is a trend?
A trend is the general direction the market is moving in. In an uptrend, price keeps making higher highs and higher lows. In a downtrend, it keeps making lower highs and lower lows. When price moves up and down inside the same range without a clear direction, the market is sideways.
What is a trendline?
A trendline is a straight line that connects the lows of an uptrend, or the highs of a downtrend. It shows the path price has been respecting, so you can see at a glance whether the trend is still alive.
Why the third touch matters
Any two points can be joined with a line. A line only becomes meaningful when price comes back and reacts to it a third time. That third touch is the confirmation that other traders are watching the same line.
When a trendline breaks
A break of the trendline is a warning that the trend may be weakening. It does not always mean the trend has reversed, so the lesson shows how to read a break carefully instead of reacting to it straight away.
Real chart examples
- Bitcoin uptrend line: drawing the line through the lows and watching price react to it.
- Bitcoin downtrend line: the same idea through the highs, and what happened when the line broke.
- Scoreboard: across the examples in the lesson, the trendlines held 15 times and broke 3 times.
How to use a trendline in a trade
The lesson walks through a full example with an entry near the line, a stop-loss on the other side of it, and a target at the next important level.
Patterns from this lesson, in 3D
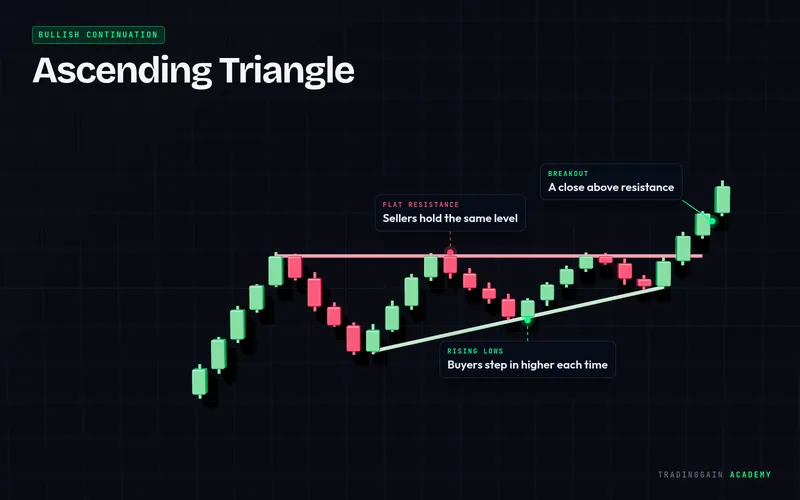
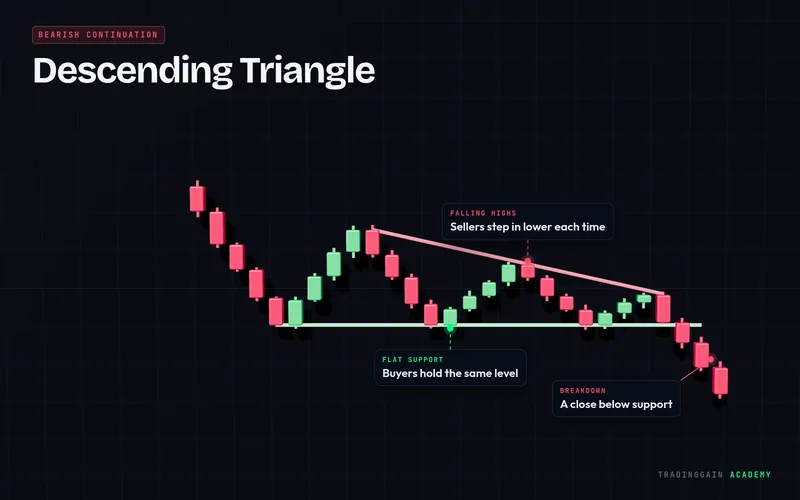
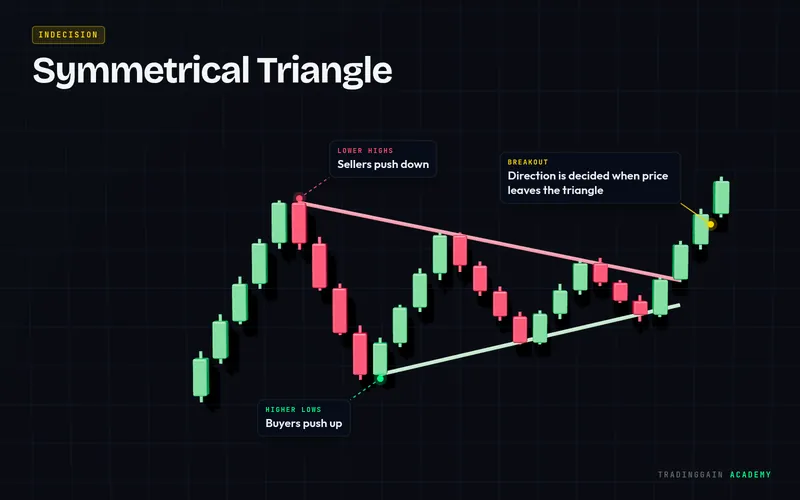
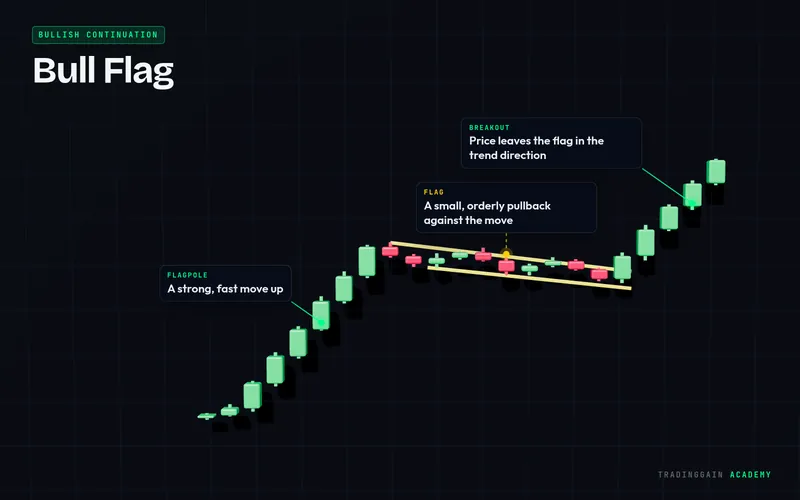
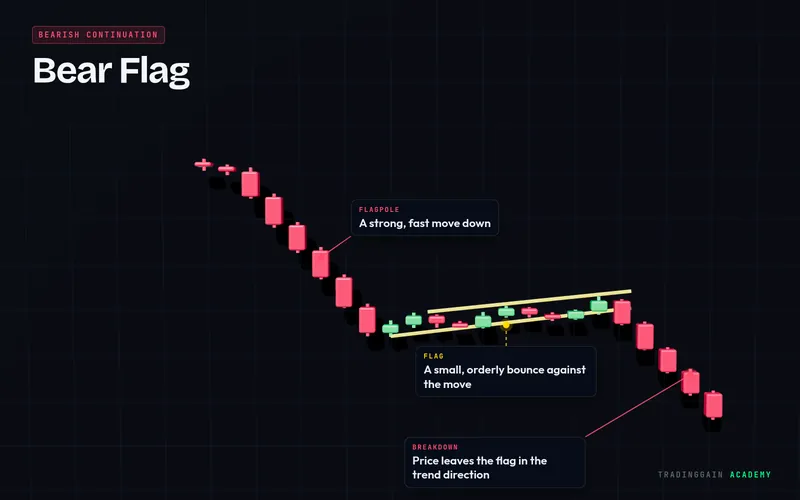
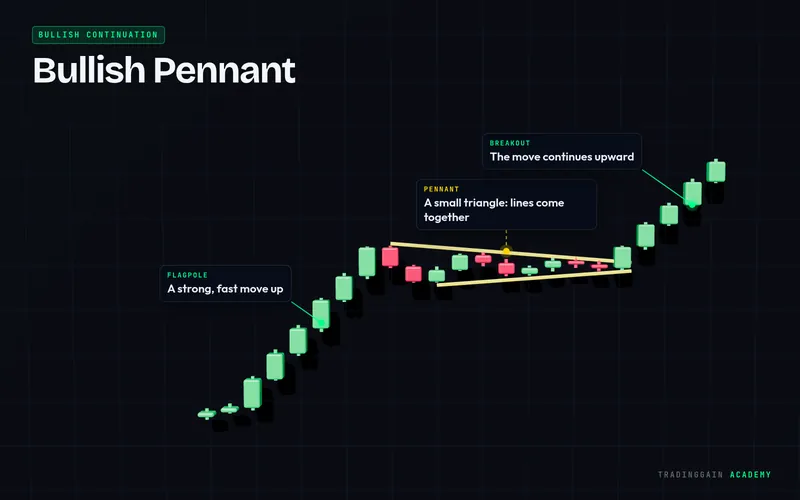
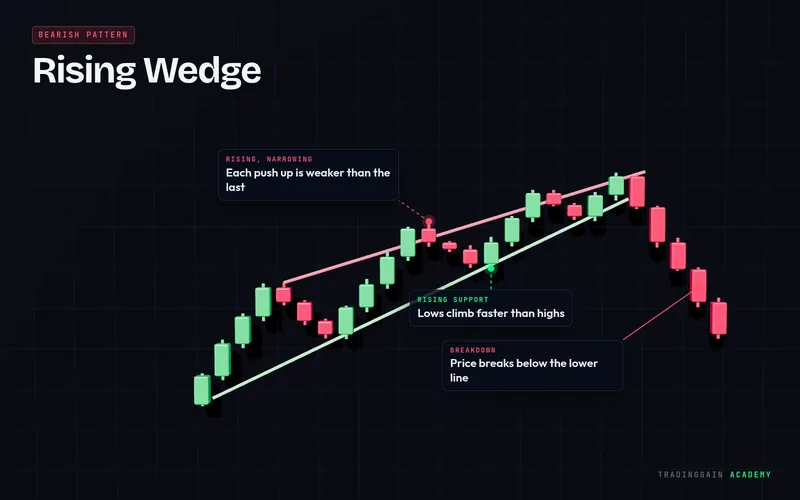
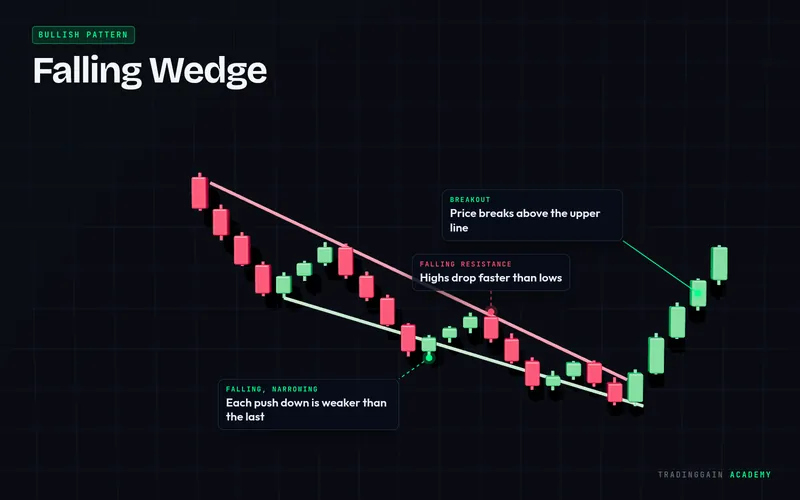
This lesson is for education only and is not financial advice. Trading is risky and you can lose money. Every example uses past market data and does not predict future results.


