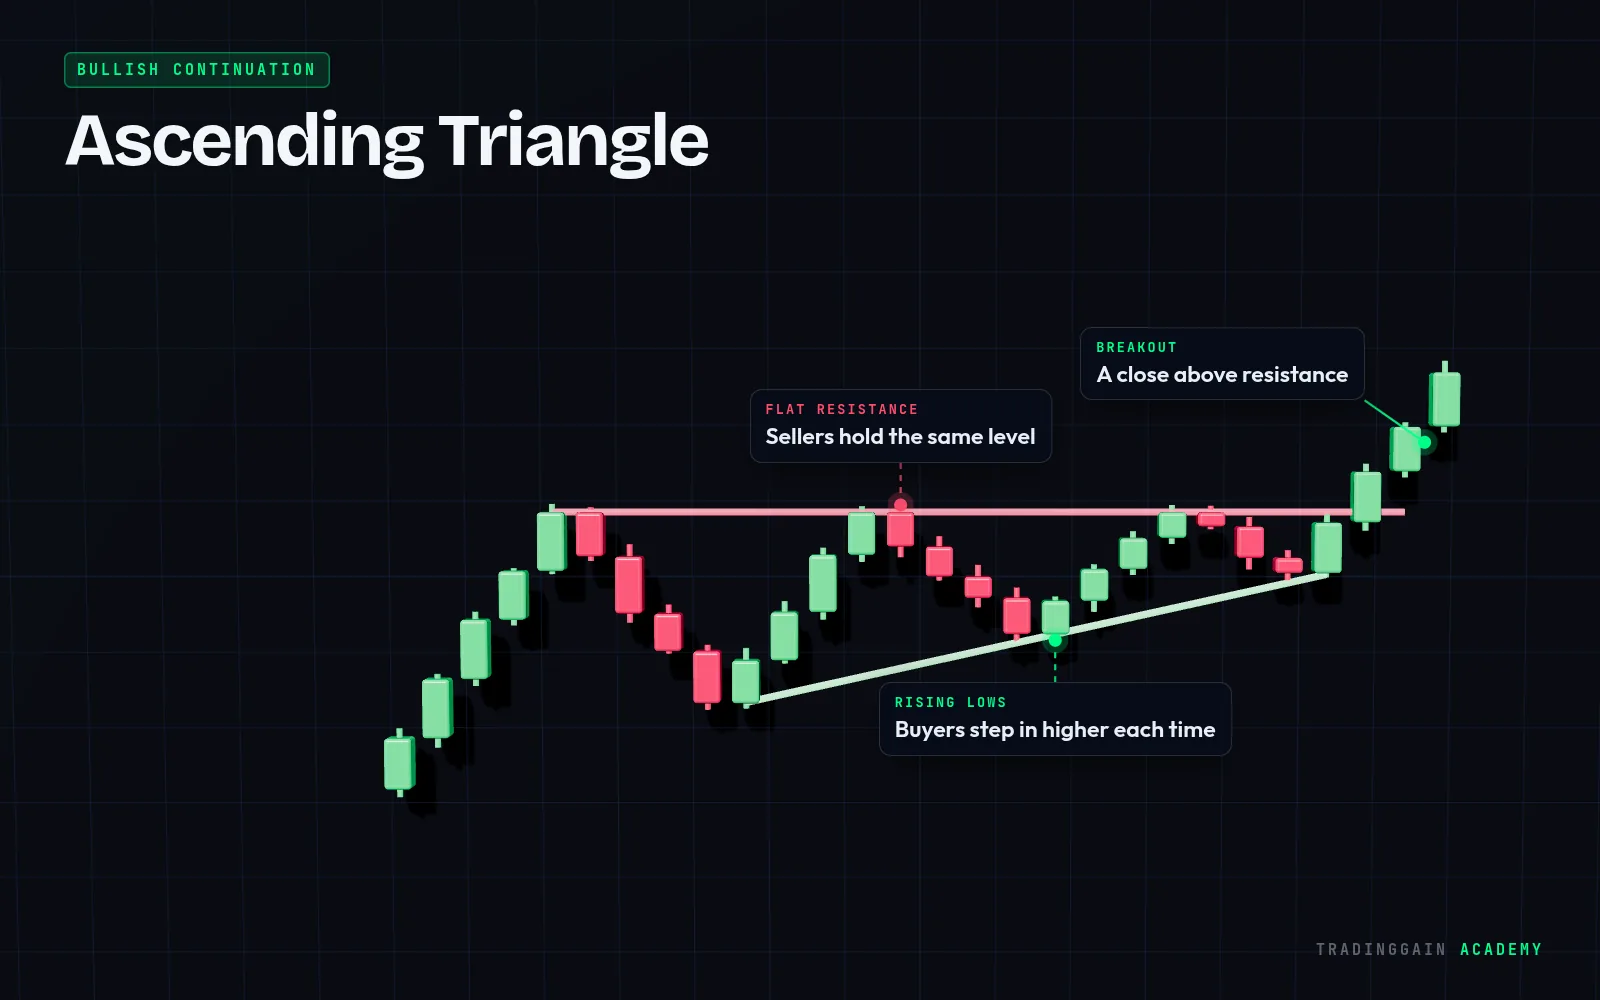
How to spot a Ascending Triangle
- A horizontal resistance touched at least twice
- A rising support line joining higher lows
- The range gets tighter over time
- Usually breaks upward, though not always
What the Ascending Triangle tells you
Each higher low shows buyers becoming more aggressive. Sellers defend one price, but the supply there is being used up, which is why the breakout is often upward.
How traders use it
- Enter on a close above resistance, ideally with higher volume
- Or wait for a retest of the old resistance as support
- Place the stop below the last higher low
- A common target is the height of the triangle projected up
Common mistakes
- Buying before the breakout
- Ignoring a breakdown below the rising line
- Trading a breakout on very low volume
 See it on a real chart · EP 03Trend and Trendlines: How to Draw ThemWatch the free lesson →
Questions about the Ascending Triangle
Is an ascending triangle bullish?
It is usually considered bullish, because buyers keep making higher lows. Confirmation comes only on a close above resistance.
What if an ascending triangle breaks down?
If price closes below the rising support line, the pattern has failed and the bullish idea is cancelled.
For education only, not financial advice. The chart is an illustration of the pattern, not real market data. No pattern works every time; always use a stop-loss.