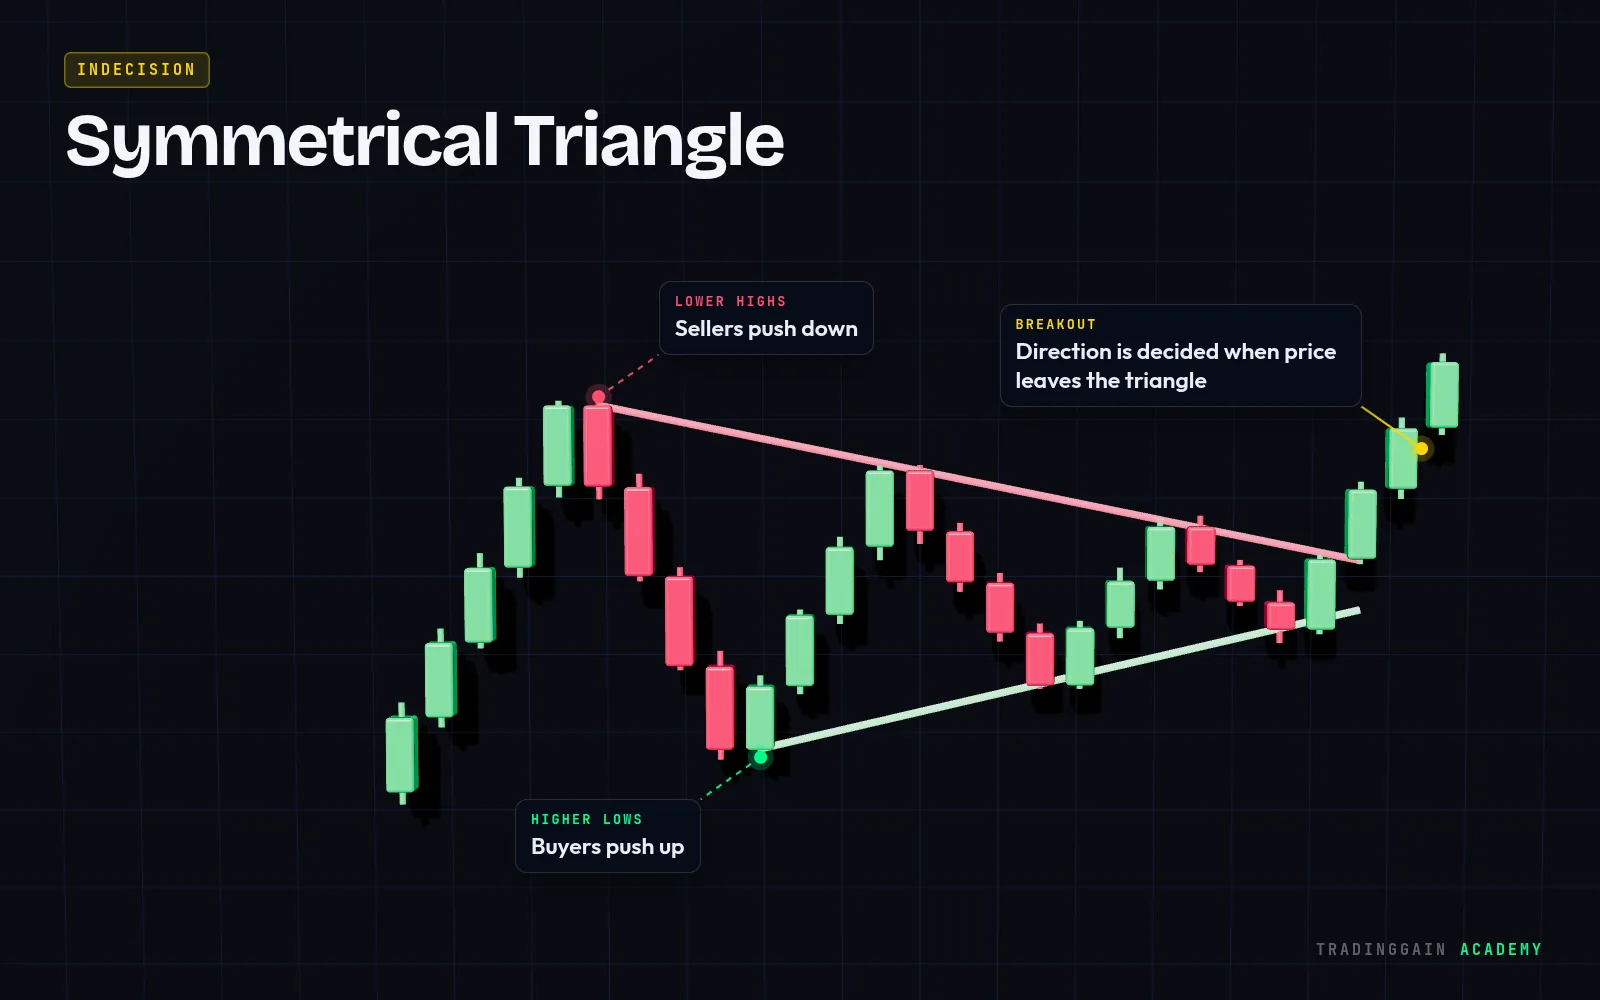
How to spot a Symmetrical Triangle
- A falling line across the lower highs
- A rising line across the higher lows
- The lines converge into a point
- Volume often shrinks inside the triangle
What the Symmetrical Triangle tells you
Buyers and sellers are both giving ground, and volatility keeps shrinking. The breakout direction is decided by whichever side wins, often in the direction of the trend before the triangle.
How traders use it
- Wait for a candle to close outside the triangle
- Enter in the direction of the break
- Place the stop back inside the triangle, beyond the last swing
- Target the widest part of the triangle projected from the breakout
Common mistakes
- Guessing the direction before the breakout
- Trading breakouts very close to the tip, where moves are often weaker
- Ignoring a quick return inside the triangle (a fake breakout)
 See it on a real chart · EP 03Trend and Trendlines: How to Draw ThemWatch the free lesson →
Questions about the Symmetrical Triangle
Is a symmetrical triangle bullish or bearish?
It is neutral until it breaks. It often continues the trend that came before it, but the breakout decides.
How do you trade a symmetrical triangle?
Wait for a close outside one of the lines, enter in that direction, and place the stop back inside the pattern.
For education only, not financial advice. The chart is an illustration of the pattern, not real market data. No pattern works every time; always use a stop-loss.