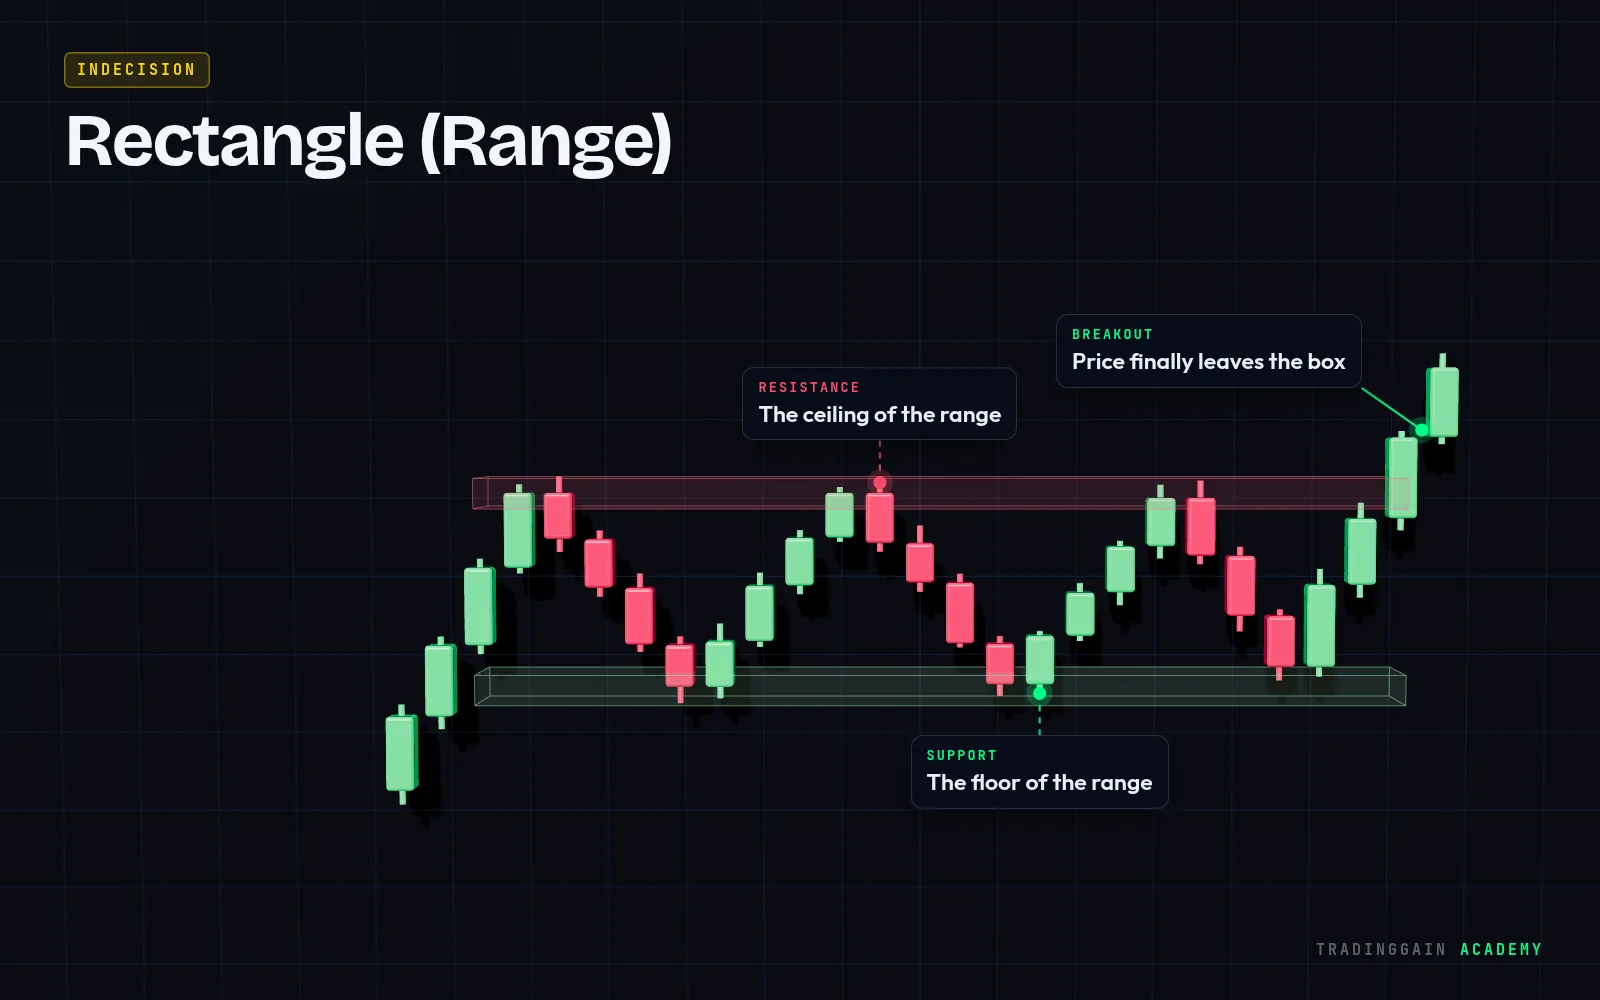
How to spot a Rectangle (Range)
- A horizontal resistance on top
- A horizontal support at the bottom
- Several touches of each level
- Ends with a breakout up or down
What the Rectangle (Range) tells you
Buyers and sellers are in balance. Orders build up at both edges, so the breakout from a long range can be strong. Before it, the trend is simply paused.
How traders use it
- Inside the range: buy near support, sell near resistance, with tight stops
- For the breakout: enter on a close outside the box
- Place the stop back inside the range
- A common target is the height of the range projected from the breakout
Common mistakes
- Trading the middle of the range
- Chasing a breakout that closes back inside (a fake breakout)
- Using trend-following tools inside a range
 See it on a real chart · EP 02Support & Resistance: How to Draw ThemWatch the free lesson →
Questions about the Rectangle (Range)
What is a rectangle pattern in trading?
It is a sideways range where price bounces between flat support and resistance until it breaks out.
Is a rectangle bullish or bearish?
Neither on its own. The direction of the breakout decides.
For education only, not financial advice. The chart is an illustration of the pattern, not real market data. No pattern works every time; always use a stop-loss.