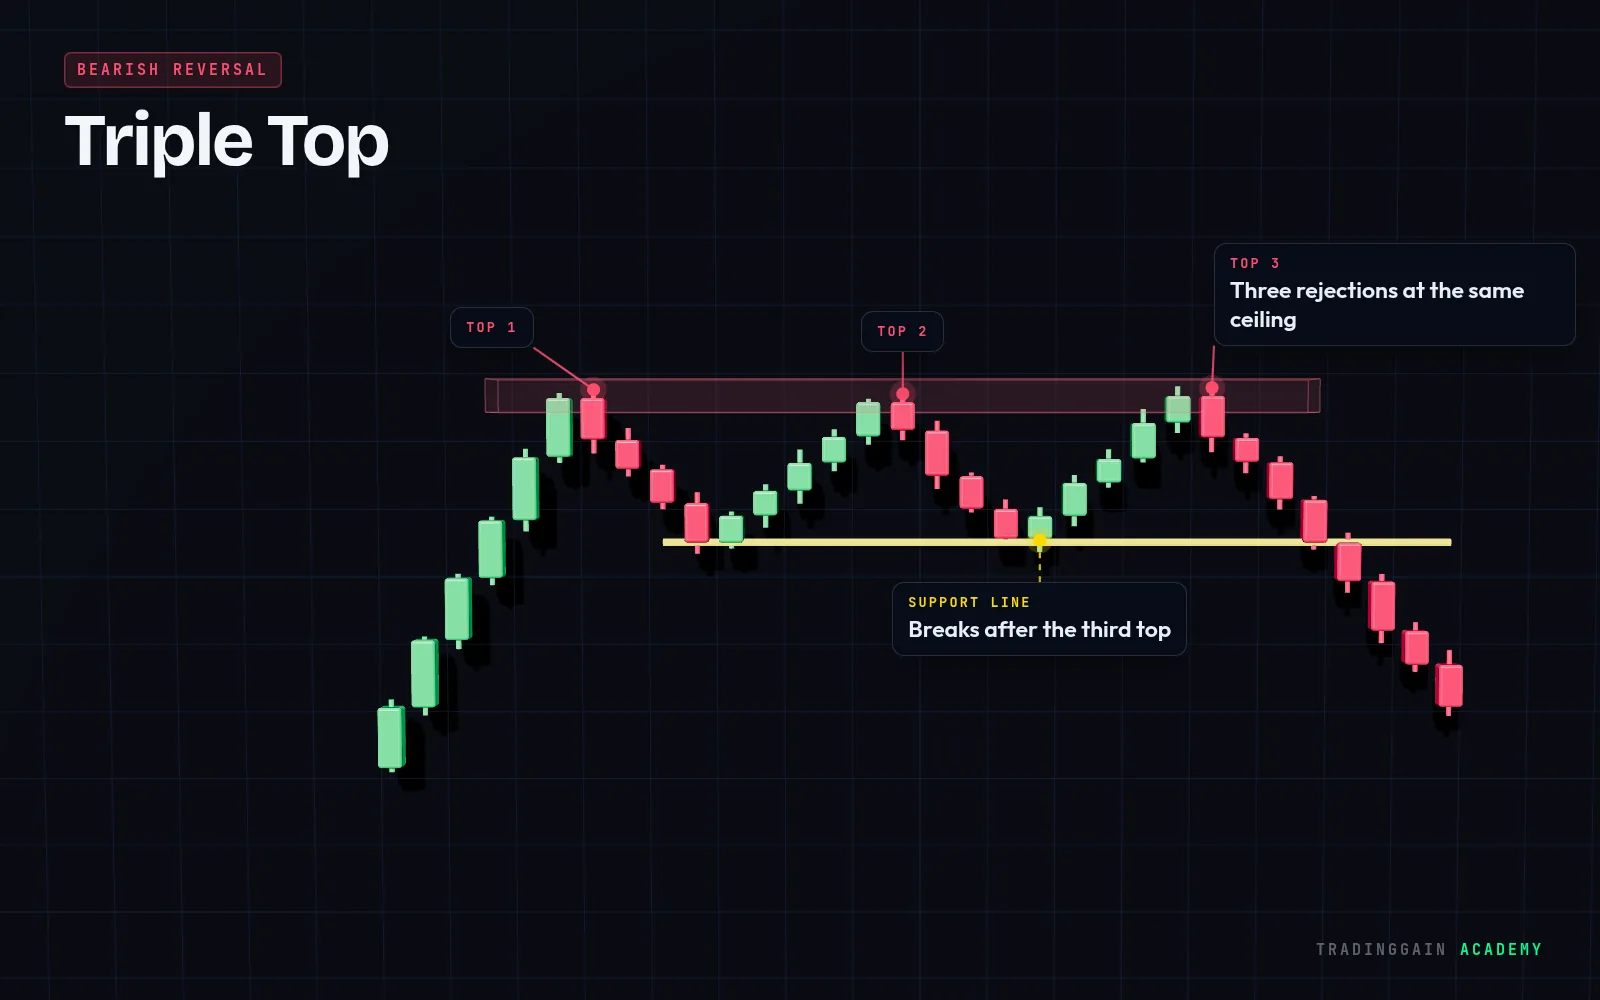
How to spot a Triple Top
- Forms after an uptrend
- Three peaks at roughly the same level
- A support line runs under the pullbacks
- Completes on a close below that support
What the Triple Top tells you
Three failures at one ceiling show strong, repeated selling. When support finally breaks, many buyers are trapped above.
How traders use it
- Enter short on a close below the support line or on its retest
- Place the stop above the third top
- Target the height of the pattern projected down
Common mistakes
- Shorting the third top before support breaks
- Mixing it up with a range that later breaks upward
- No stop-loss
 See it on a real chart · EP 02Support & Resistance: How to Draw ThemWatch the free lesson →
Questions about the Triple Top
Is a triple top bearish?
Yes, once the support line under the three peaks breaks. Until then, it is a range.
Is a triple top stronger than a double top?
Three rejections show the level is very well defended, but the pattern is still only confirmed on the break of support.
For education only, not financial advice. The chart is an illustration of the pattern, not real market data. No pattern works every time; always use a stop-loss.