// Definition
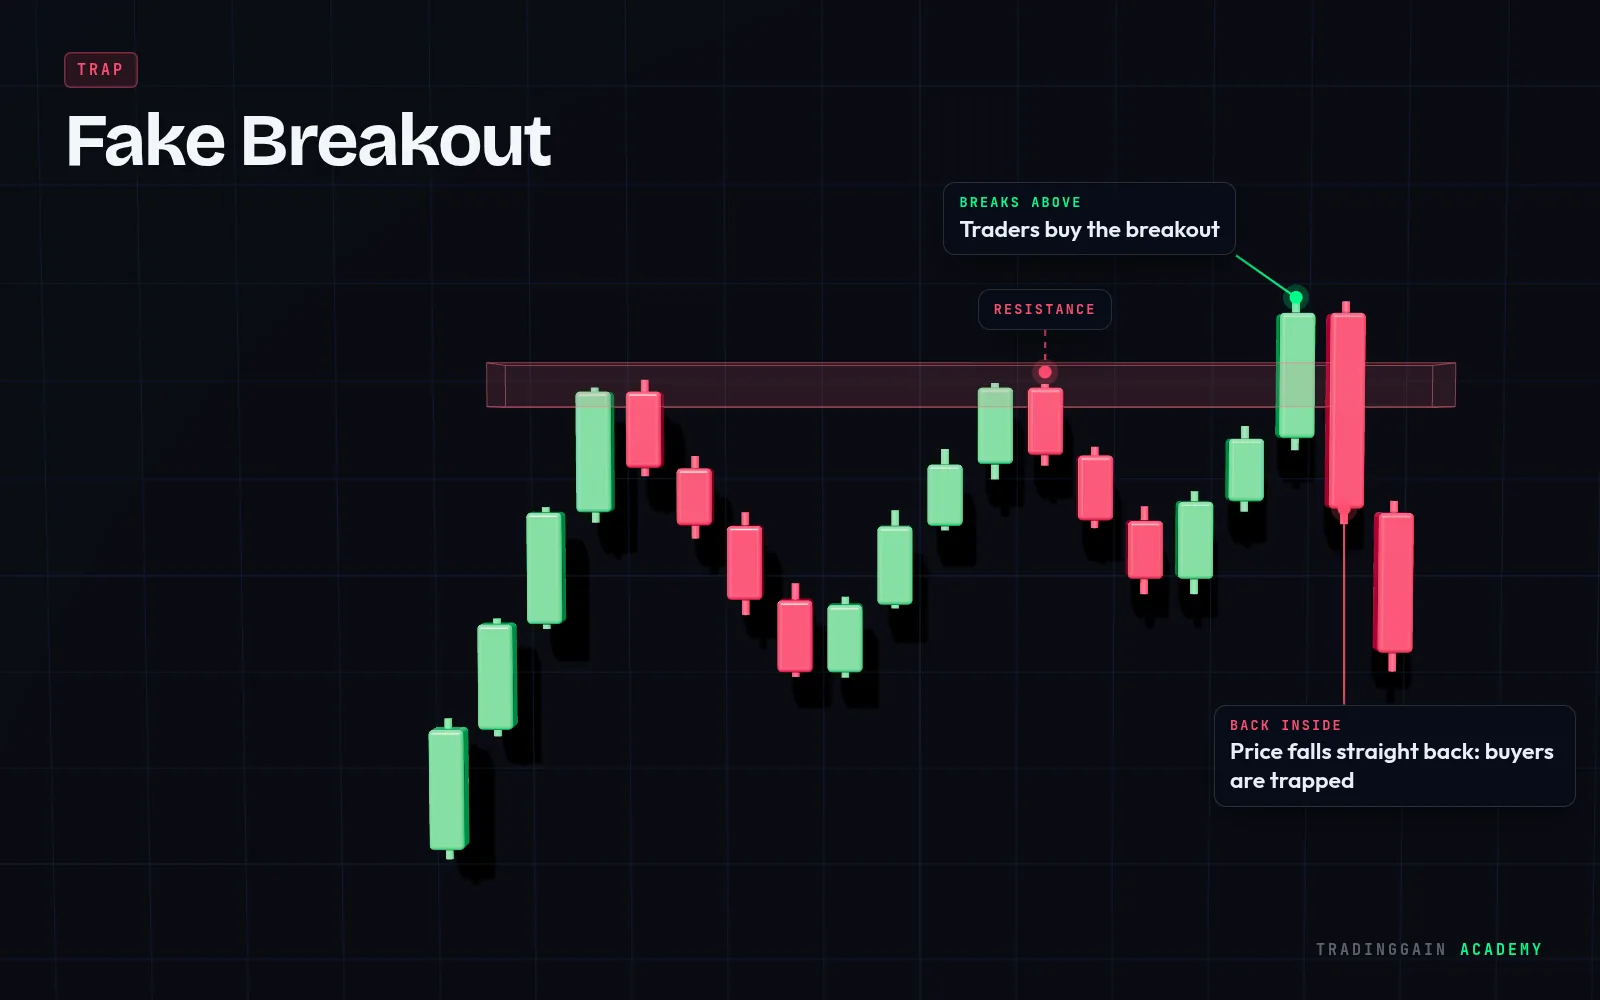
A fake breakout is when price moves beyond a level but quickly returns back inside, trapping traders who entered on the break.
Explained simply
Price pokes above resistance (or below support), traders buy (or sell) expecting a big move, and then price falls straight back inside the range. Those traders are now trapped on the wrong side.
Fake breakouts often happen on low volume, or when price only wicks through a level without a strong close beyond it.
Tip
Checking the close and the volume of the breakout candle filters out many fake breakouts.
 Learn it on a real chart · EP 02Support & Resistance: How to Draw ThemWatch the free lesson →
For education only, not financial advice. Trading is risky and you can lose money.