// Definition
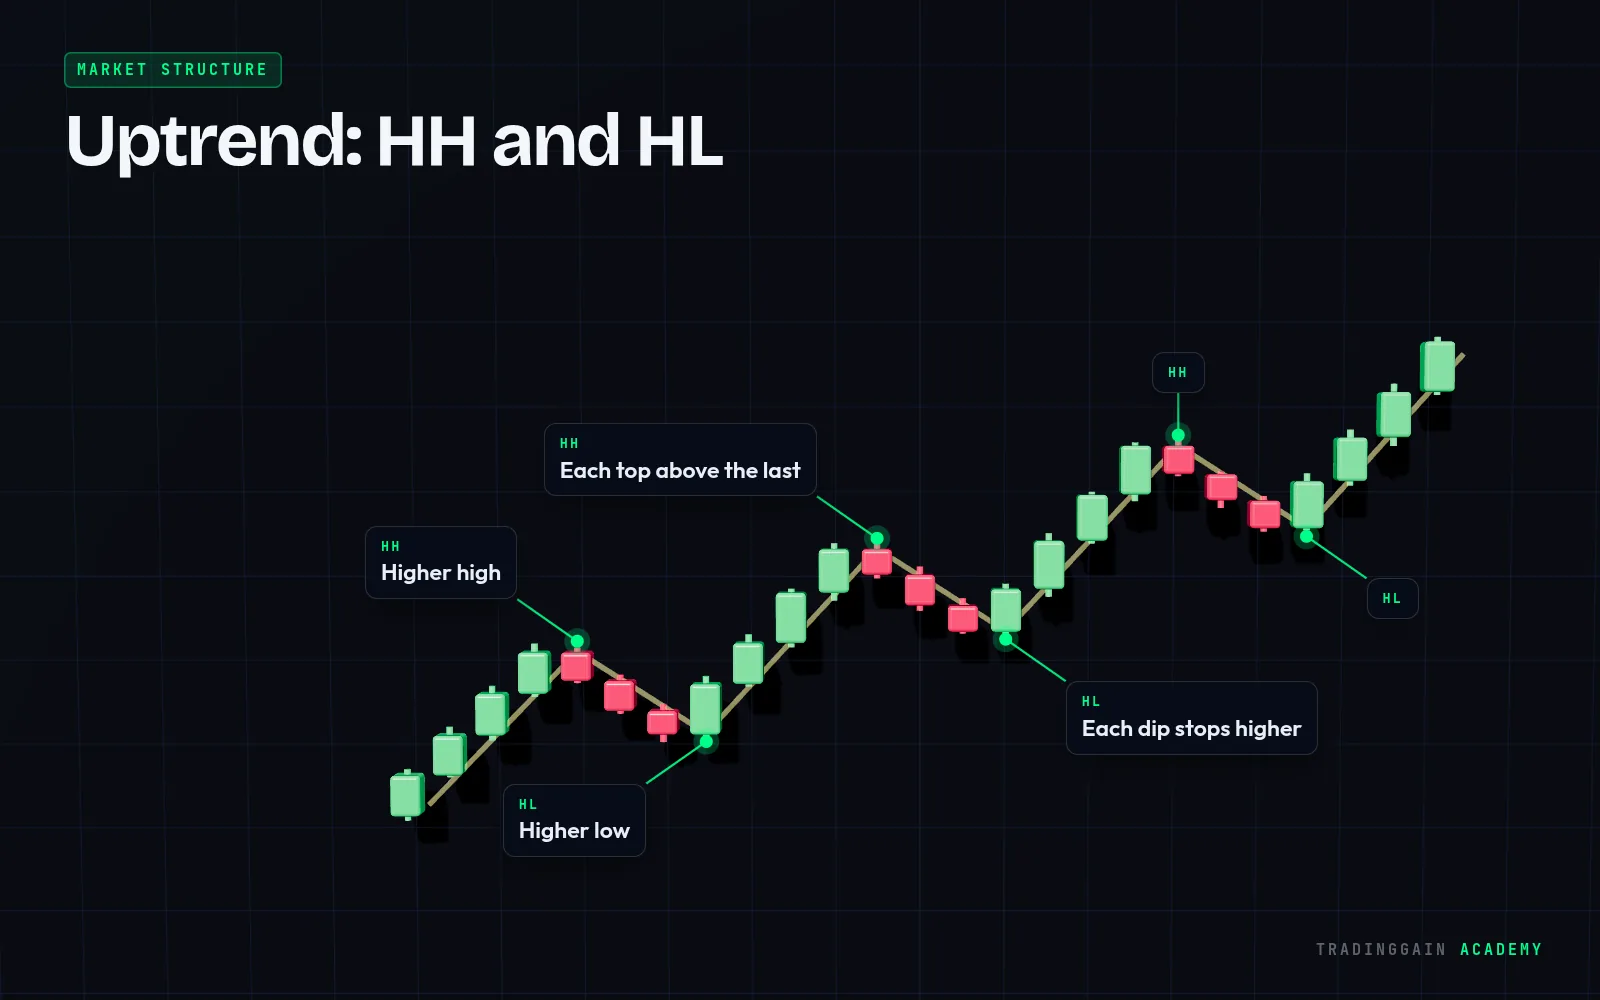
A higher low is a pullback that stops above the previous low. A series of higher lows is a sign of an uptrend.
Explained simply
In an uptrend, buyers do not wait for price to fall all the way back. They buy earlier on each dip, so every pullback ends higher than the last one.
The most recent higher low is the key level of an uptrend. As long as it holds, the uptrend is intact. A close below it is the first sign that structure is changing.
Tip
Higher lows are where many trend traders look to enter, with the stop-loss just below the low.
 Learn it on a real chart · EP 04Market Structure: HH, HL, LH and LLWatch the free lesson →
For education only, not financial advice. Trading is risky and you can lose money.