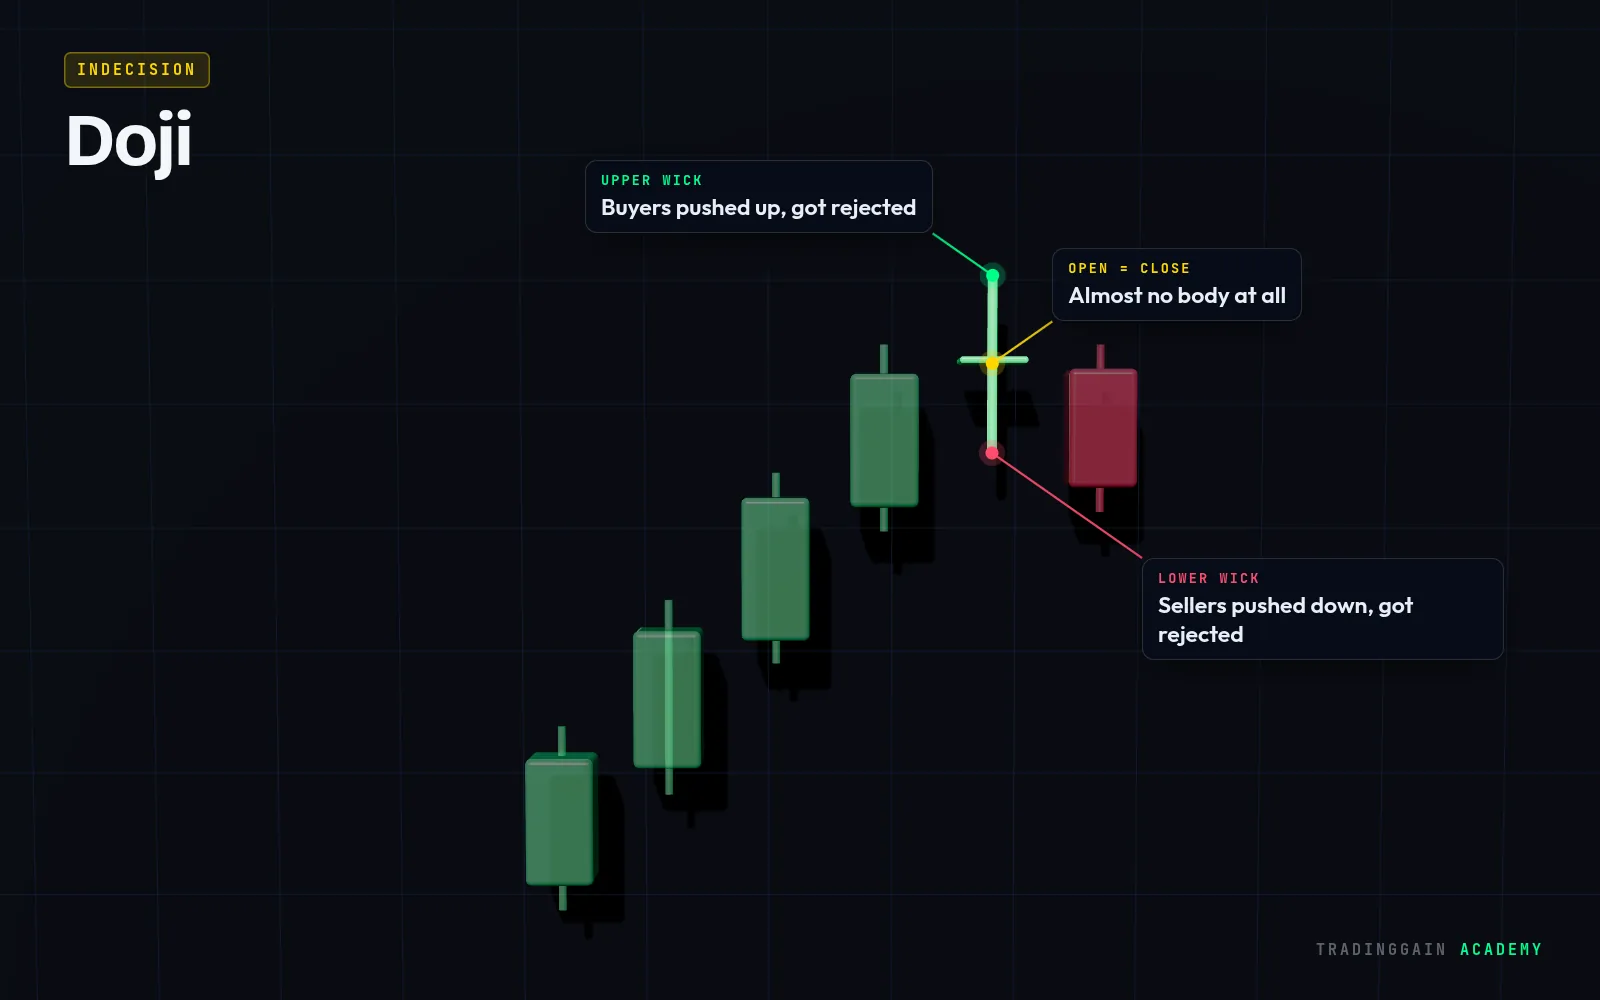
How to spot a Doji
- The body is very thin, often just a line
- There are wicks above, below or on both sides
- It matters most after a strong move or at a key level
What the Doji tells you
During the candle, price moved up and down, but by the close neither side had won. After a strong rally or drop, that loss of momentum can be the first sign that the move is tiring. On its own, though, a doji only says one thing: the market is undecided.
How traders use it
- Wait for the next candle to show which side takes over
- After a rally, a red candle closing below the doji is a bearish hint; after a drop, a green close above it is a bullish hint
- Place the stop beyond the doji high or low, depending on the direction
Common mistakes
- Trading a doji on its own without confirmation
- Reading every small-bodied candle as a signal, even in the middle of a range
- Ignoring the trend and the level where the doji formed
 See it on a real chart · EP 01Candlestick Patterns for BeginnersWatch the free lesson →
Questions about the Doji
Is a doji bullish or bearish?
Neither by itself. A doji shows indecision. It becomes bullish or bearish only when the next candles confirm a direction, and it carries more weight at support or resistance.
What are the types of doji?
The main types are the standard doji, the long-legged doji, the dragonfly doji with a long lower wick, and the gravestone doji with a long upper wick.
For education only, not financial advice. The chart is an illustration of the pattern, not real market data. No pattern works every time; always use a stop-loss.