// Definition
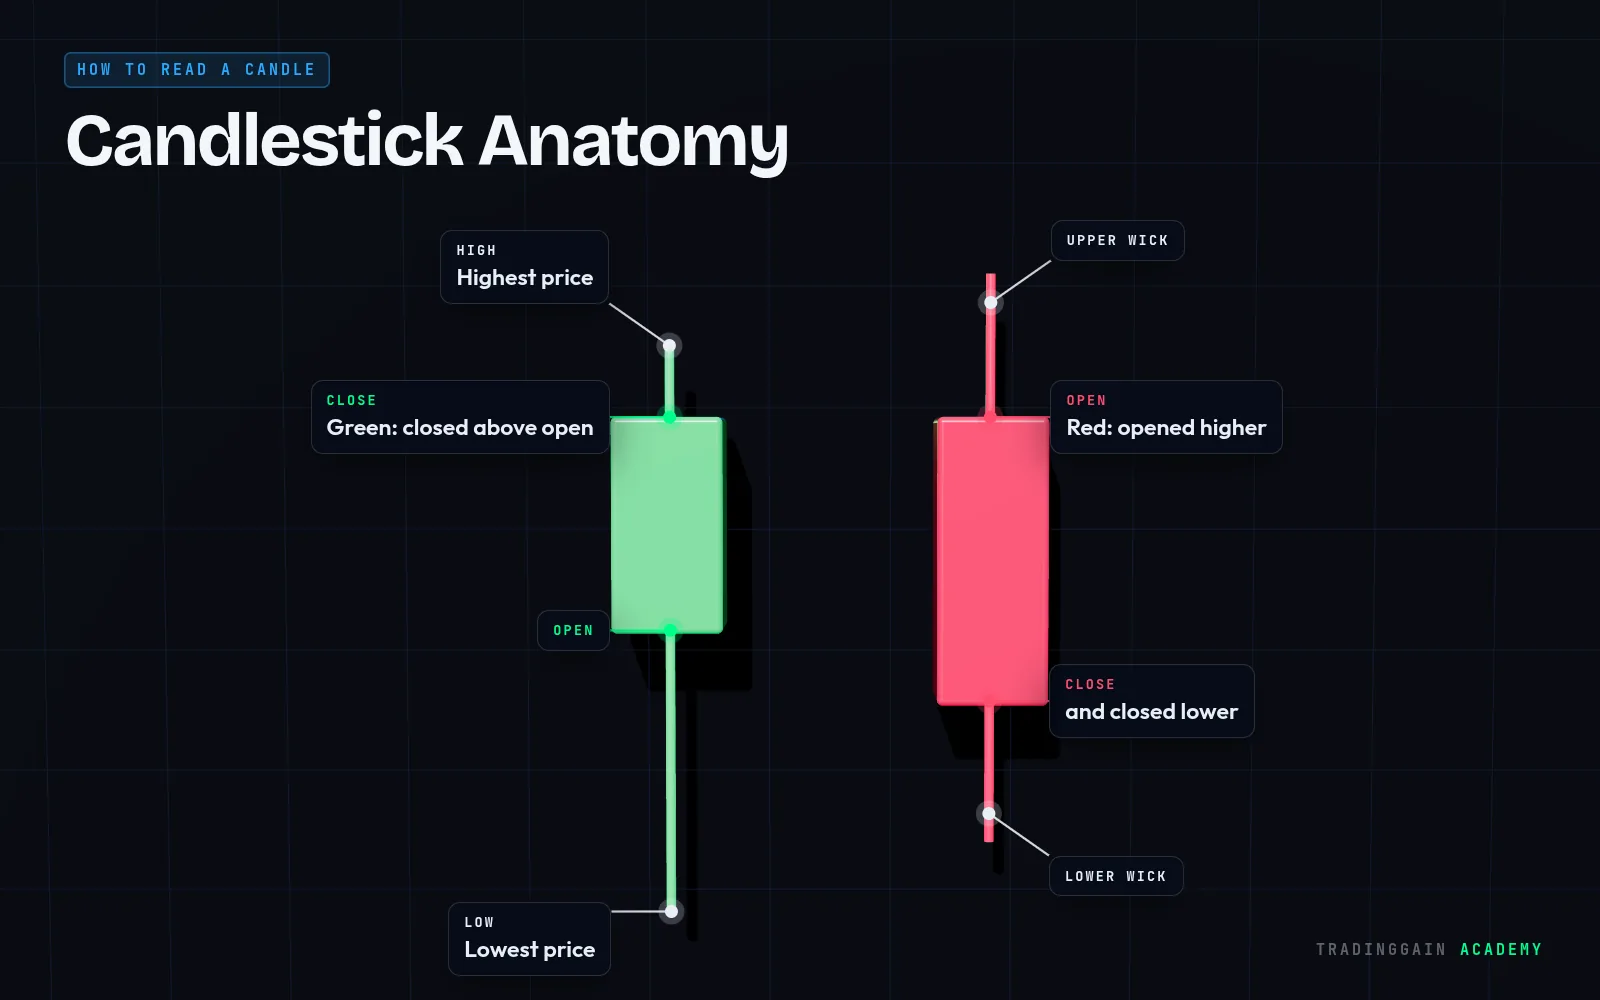
A wick is the thin line above or below a candle body that shows the highest and lowest prices reached during that period.
Explained simply
An upper wick shows how high price went before falling back. A lower wick shows how low price went before recovering.
Long wicks are a sign of rejection. A long lower wick means sellers pushed price down but buyers pushed it back up before the close. A long upper wick means buyers tried to push higher but sellers rejected the move.
Tip
A long wick at a support or resistance level tells you far more than the same wick in the middle of a range.
 Learn it on a real chart · EP 01Candlestick Patterns for BeginnersWatch the free lesson →
For education only, not financial advice. Trading is risky and you can lose money.