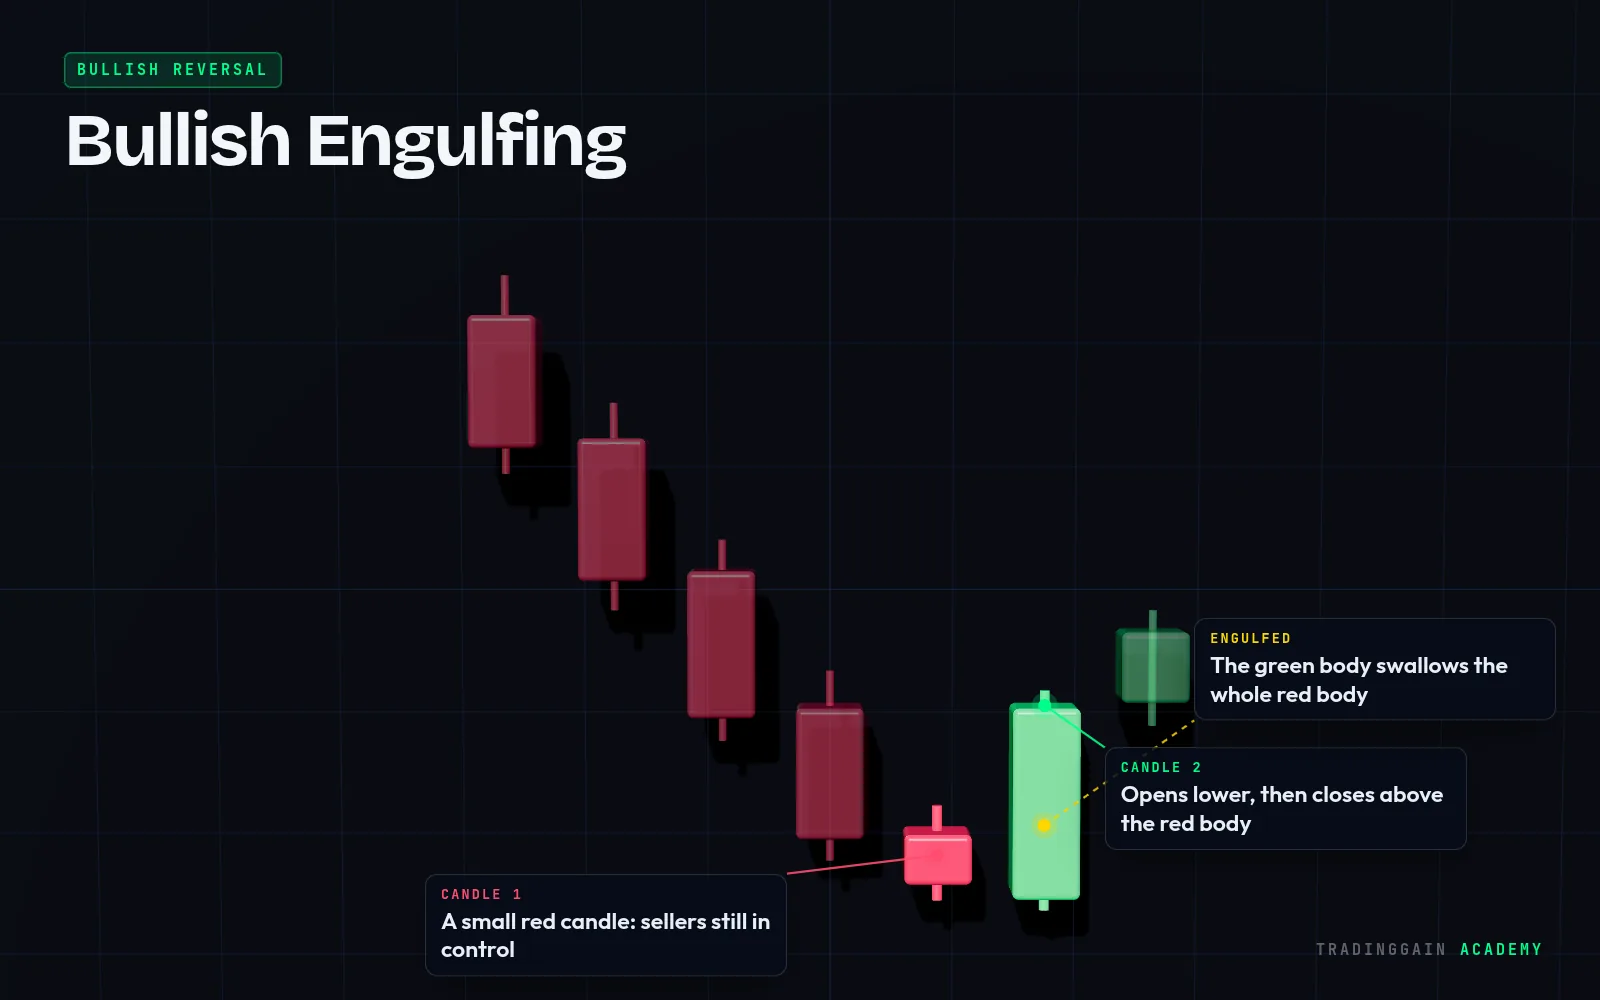
How to spot a Bullish Engulfing
- Appears after a decline
- Candle 1 is red
- Candle 2 is green and its body covers the whole body of candle 1
- Stronger when candle 2 has above-average volume
What the Bullish Engulfing tells you
Sellers were in charge on the first candle. On the second, price opened at or below that close and then rallied to close above the first candle's open. That complete shift in control, especially at support, is a strong reversal signal.
How traders use it
- Enter on the close of the engulfing candle or on a small pullback
- Place the stop below the low of the pattern
- Target the next resistance zone
- Risk only a small, fixed part of your account on the trade.
Common mistakes
- Trading it inside a range where it means little
- Ignoring volume
- Using it against a strong higher-timeframe downtrend without a key level
 See it on a real chart · EP 01Candlestick Patterns for BeginnersWatch the free lesson →
Questions about the Bullish Engulfing
Is a bullish engulfing pattern reliable?
It is one of the stronger candlestick signals, especially at support, with high volume and in line with the higher-timeframe trend. No pattern works every time, so always use a stop-loss.
Do the wicks need to be engulfed too?
The usual rule only needs the body of the second candle to cover the body of the first. Covering the wicks as well makes it even stronger.
For education only, not financial advice. The chart is an illustration of the pattern, not real market data. No pattern works every time; always use a stop-loss.