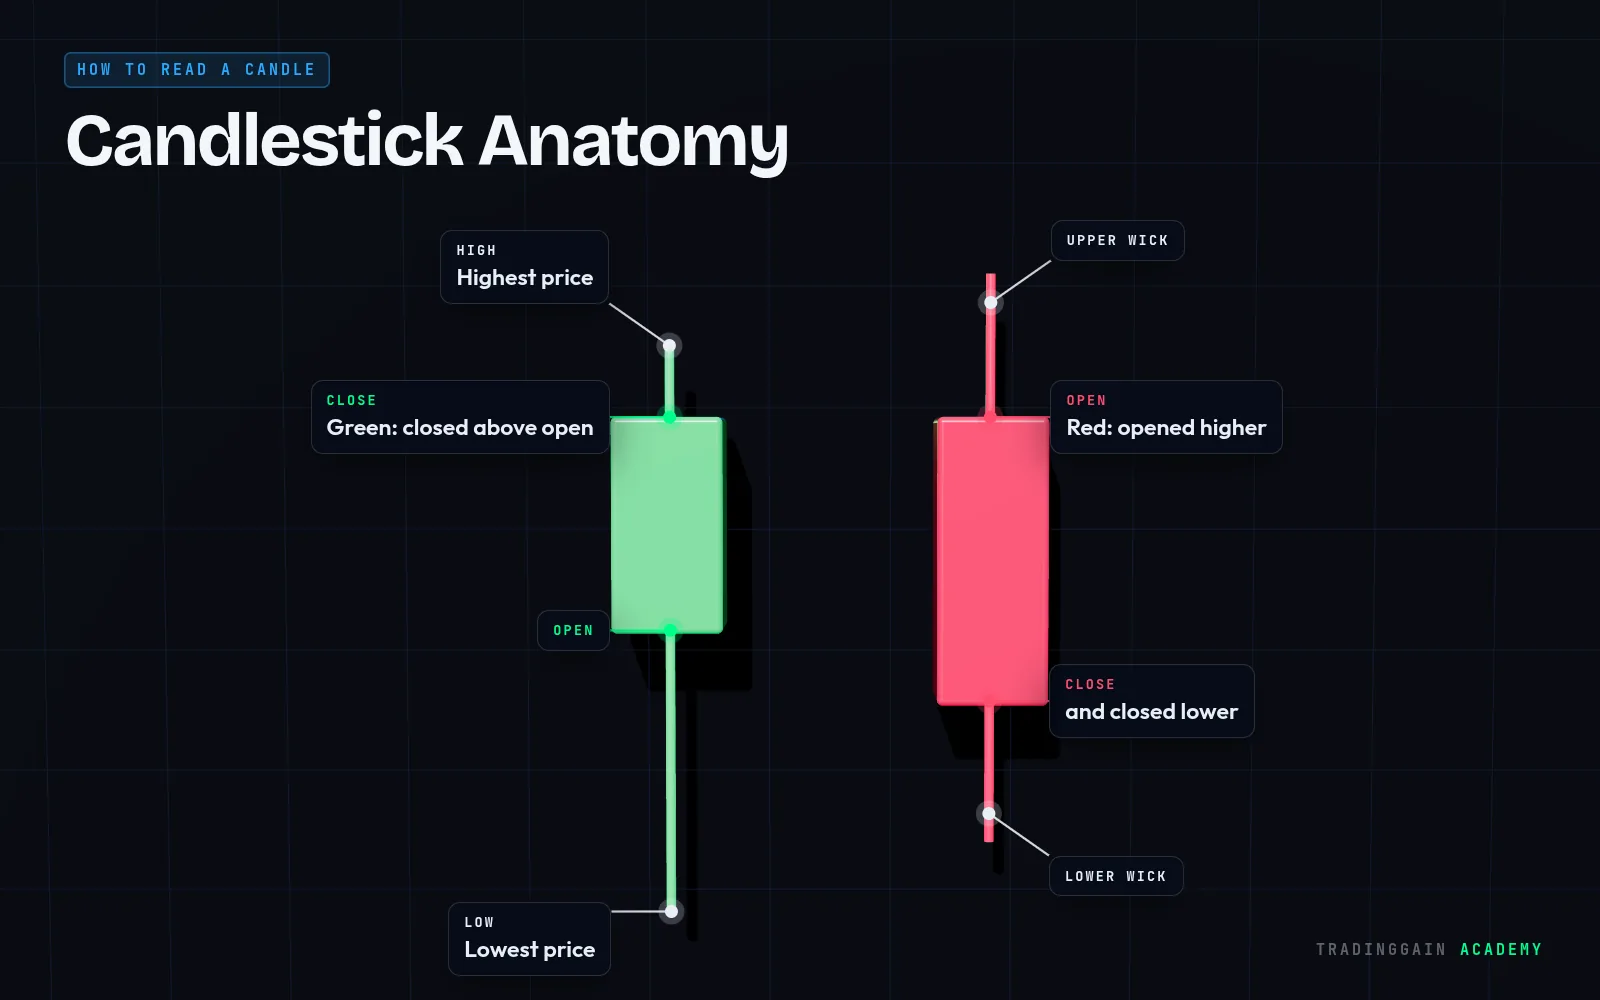
A candlestick is a single bar on a price chart that shows where price opened, how high and how low it went, and where it closed during one period of time.
Explained simply
Each candle covers one fixed period, such as 15 minutes, 1 hour or 1 day, depending on the timeframe of the chart. Its thick part is the body and its thin lines are the wicks.
Candlestick charts are popular because one glance tells you who was in control during that period. A long green body means buyers pushed price up strongly. A long red body means sellers pushed it down. Long wicks show that price was pushed somewhere and then rejected.
Never judge a market from one candle alone. Read it together with the candles around it and the level it formed at.
 Learn it on a real chart · EP 01Candlestick Patterns for BeginnersWatch the free lesson →
For education only, not financial advice. Trading is risky and you can lose money.