// Definition
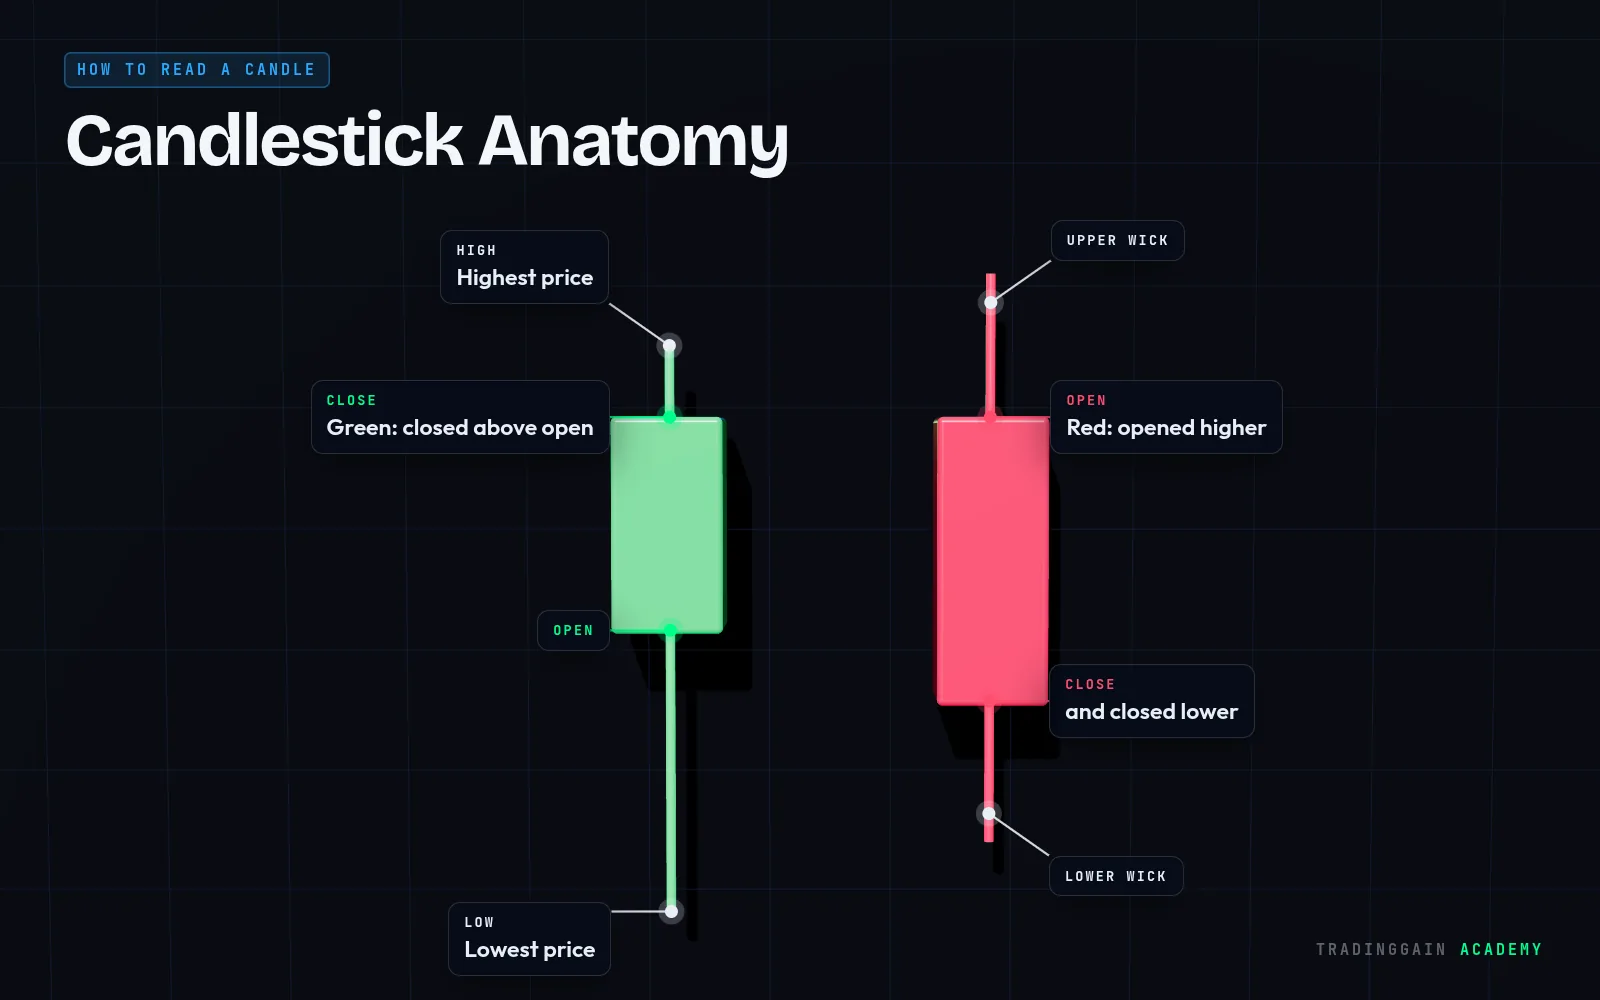
A bearish candle is a candle that closed lower than it opened, usually shown in red.
Explained simply
A bearish candle means sellers won that period: price ended below where it started.
A long red body with little wick shows heavy selling. A red candle with a long lower wick shows that sellers pushed price down but buyers stepped in before the close.
Tip
Read red candles with volume. A big red candle on high volume carries much more weight than one on thin volume.
 Learn it on a real chart · EP 01Candlestick Patterns for BeginnersWatch the free lesson →
For education only, not financial advice. Trading is risky and you can lose money.