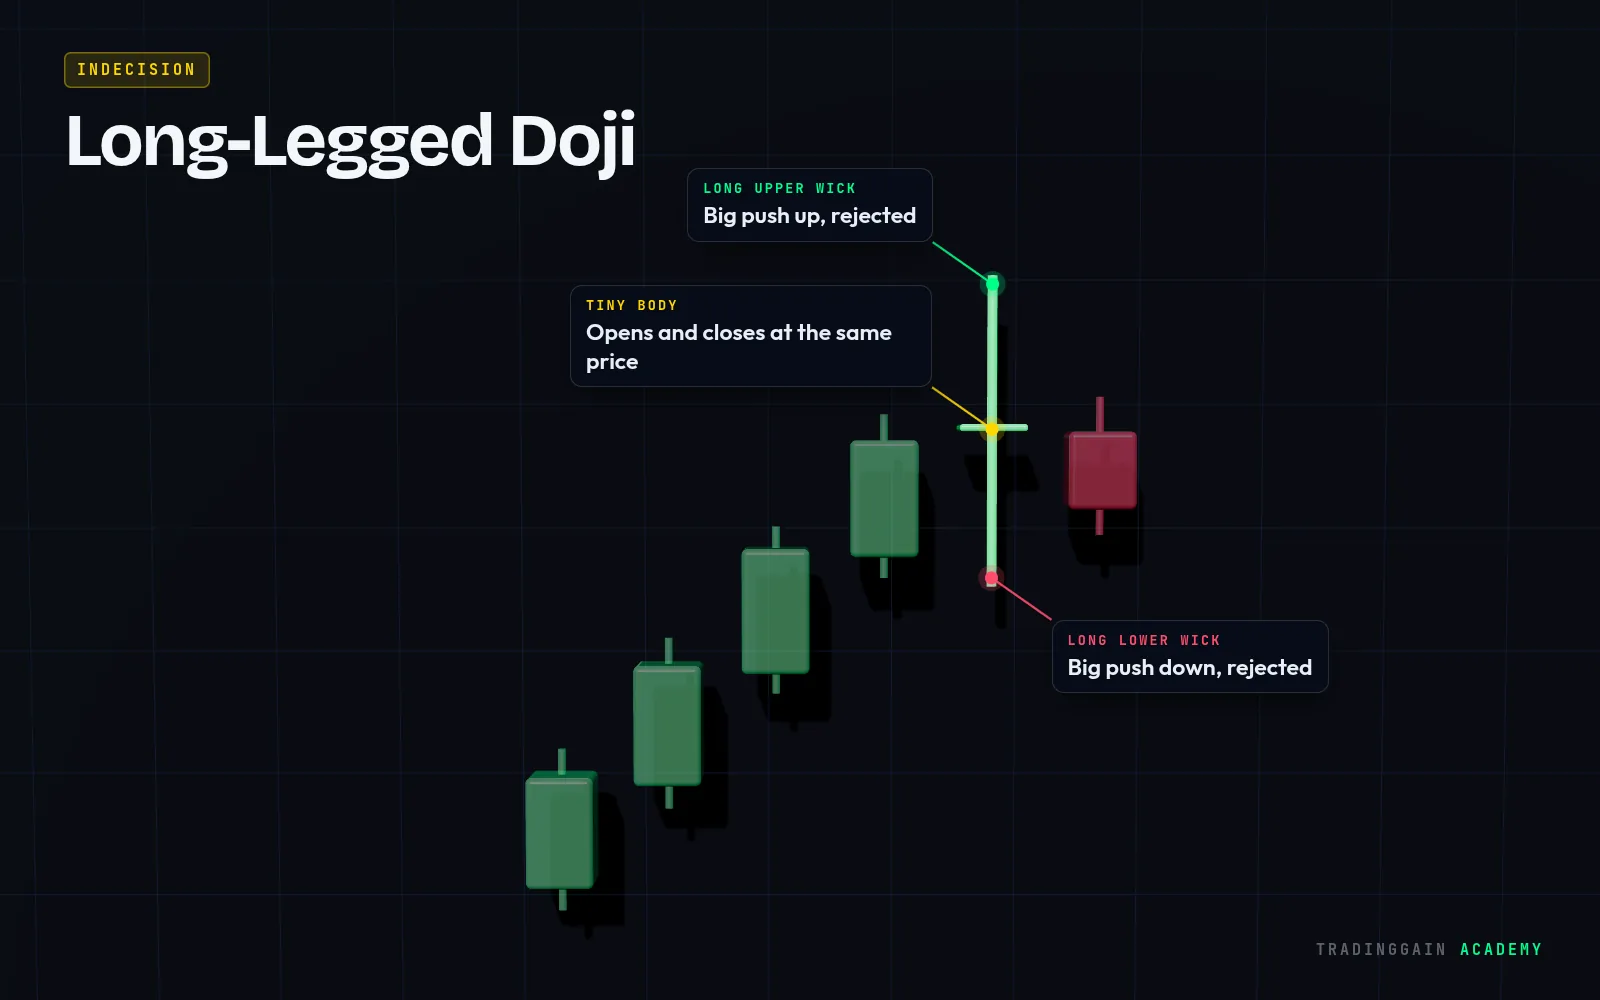
How to spot a Long-Legged Doji
- Very small body near the middle
- Long upper and lower wicks
- Often appears after a strong move or before big news
What the Long-Legged Doji tells you
Both buyers and sellers were active and strong, but neither could hold control. It signals heavy indecision, and the move after it is often decided by which side breaks the candle high or low first.
How traders use it
- Mark the high and the low of the candle
- A close above the high favours buyers; a close below the low favours sellers
- Use the opposite end of the candle as the stop
Common mistakes
- Treating it as a reversal signal by default
- Entering before price breaks either end of the candle
- Forgetting that very long wicks mean a wide stop
 See it on a real chart · EP 01Candlestick Patterns for BeginnersWatch the free lesson →
Questions about the Long-Legged Doji
What does a long-legged doji mean?
It means strong indecision: price moved far up and far down, but closed near where it opened. The next break of its high or low usually shows the next direction.
Is a long-legged doji a reversal pattern?
Not on its own. It can come before a reversal after a long trend, but it needs confirmation.
For education only, not financial advice. The chart is an illustration of the pattern, not real market data. No pattern works every time; always use a stop-loss.