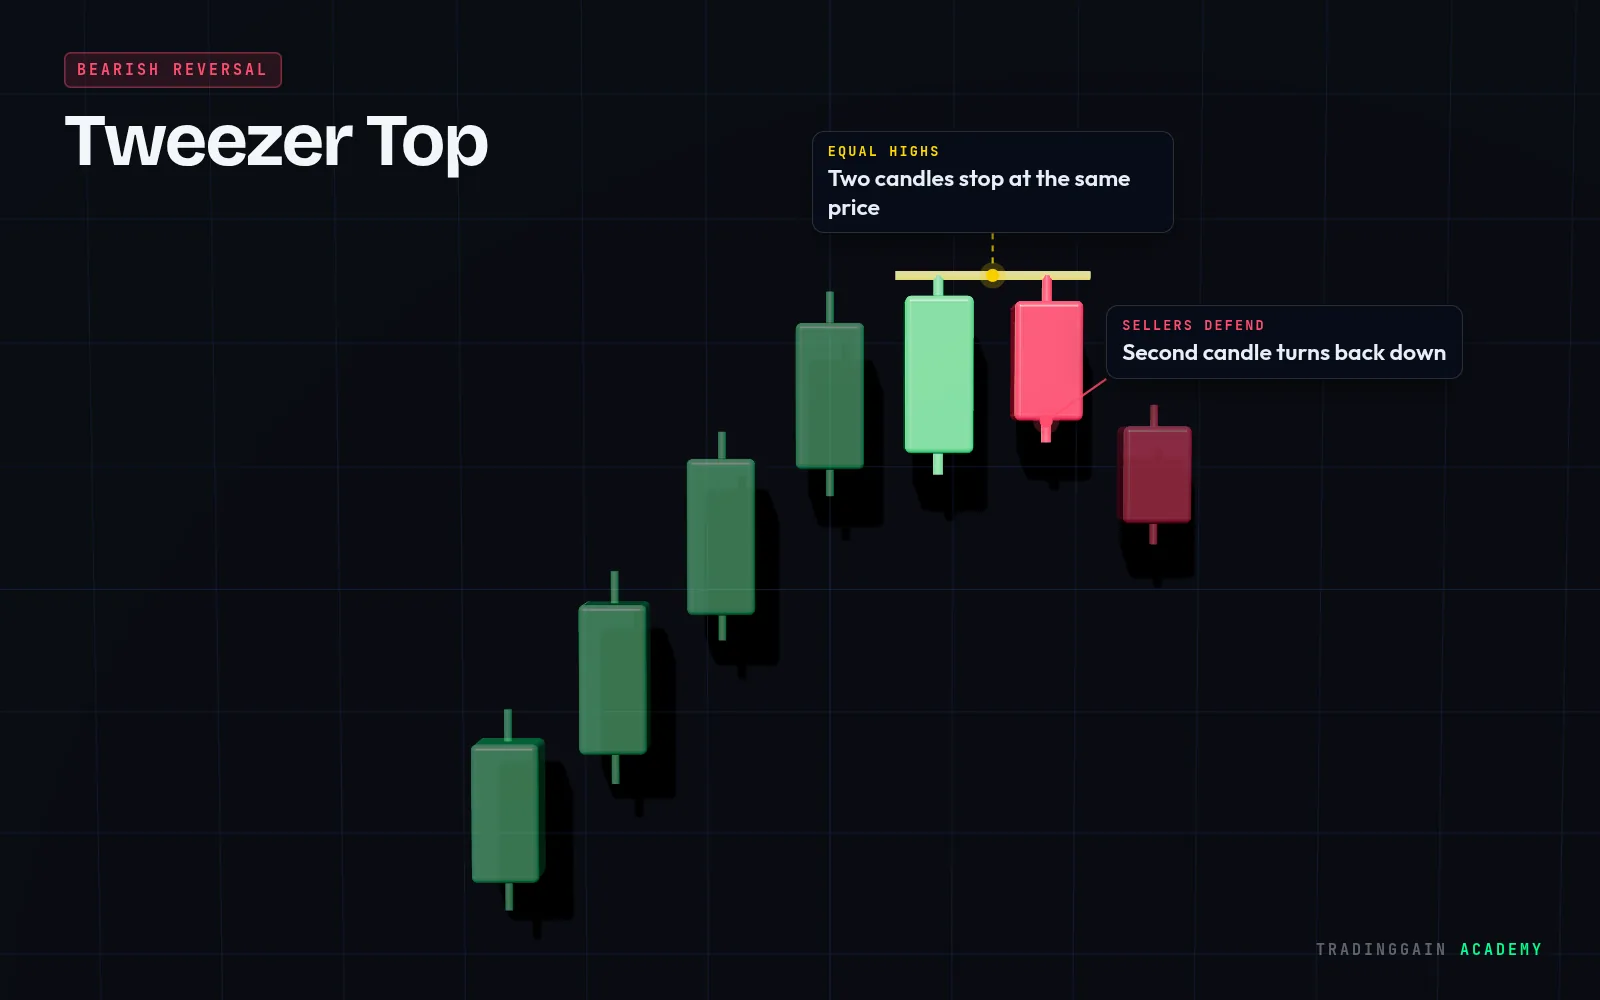
How to spot a Tweezer Top
- Appears after a rally
- Two candles with nearly equal highs
- The second candle often closes lower
What the Tweezer Top tells you
Price tested the same high twice and sellers rejected it both times. It points to a ceiling that buyers could not break.
How traders use it
- Enter after the second candle closes down, or on a confirming candle
- Place the stop above the shared high
- Target the next support
Common mistakes
- Forgetting that equal highs attract stop-losses and can be swept
- Trading it in a strong uptrend with no resistance
- Entering too early
 See it on a real chart · EP 01Candlestick Patterns for BeginnersWatch the free lesson →
Questions about the Tweezer Top
What is a tweezer top?
It is a bearish reversal where two consecutive candles stop at the same high, showing sellers defending that price.
Tweezer top vs double top?
A tweezer top happens on two back-to-back candles. A double top is a larger chart pattern with two peaks separated by a pullback.
For education only, not financial advice. The chart is an illustration of the pattern, not real market data. No pattern works every time; always use a stop-loss.